
MPJs list of 14 best data visualization inspiration resources
14 curated sources where working data viz practitioners actually go for ideas, now collected in a public GitHub repo.


Good Monday-ish Morning to you!
Creating a resource
As I've been writing these chronicles, it's been important to have sources of inspiration, and I'm starting to build a mess of links and resources, and I figured that I would never really organize them well unless I shared them publicly.
I present to you my fledgling little Github repo for this:
https://github.com/funfunfunction/fff-dataviz-resources
For now it's just markdown files (PRs welcome) but will hopefully turn into a more sophisticated directory with a searchable index over time, etc. We'll see where it goes.
Because I am not in my most creative and energetic self this week and already late with the chronicle, I am going to reproduce the directory as this week's chronicle.
Again, please send in your tips as PRs or just to mpj@fff.dev, and I'll make sure it's to everyone's benefit. In addition, if you have projects of your own, please send them in and I'll start a "made by Fun Fun Function" category.
Without further adoooo
The Pudding
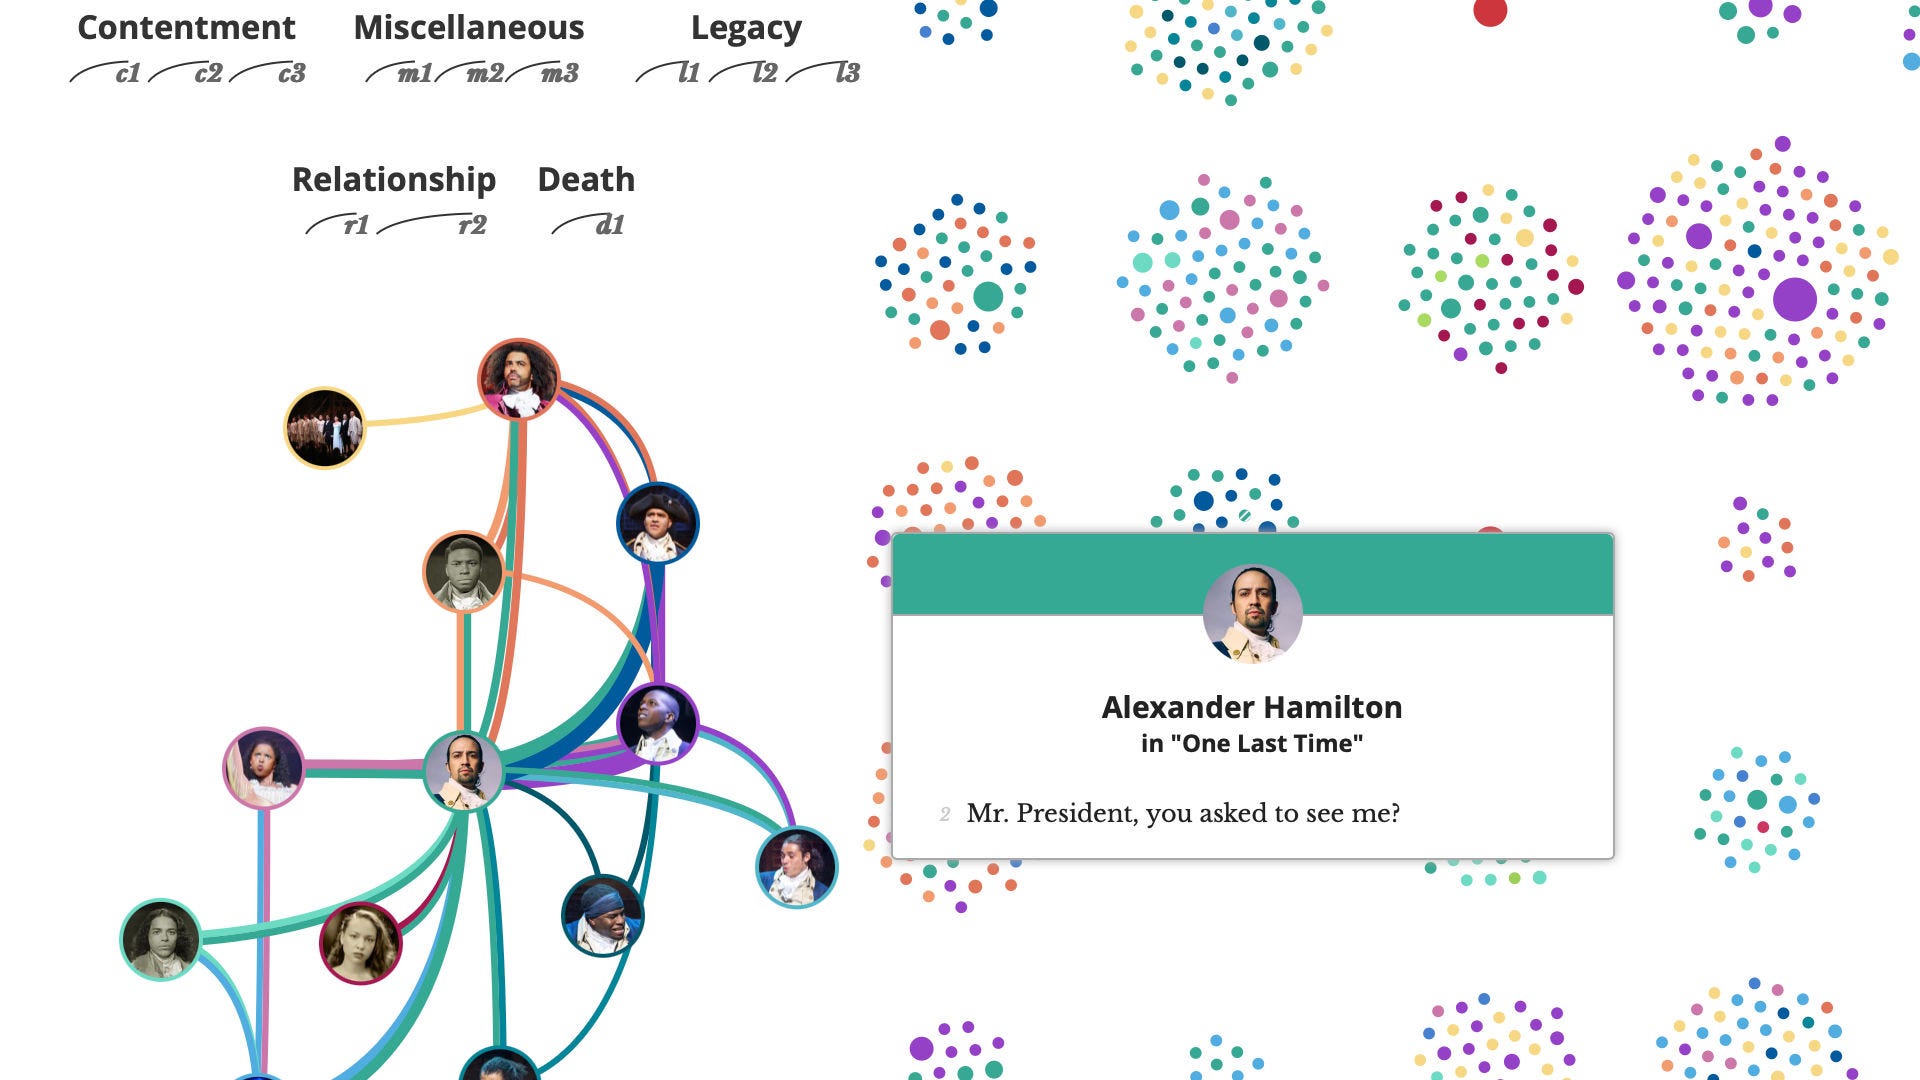
Aaaah...The Pudding! The Pudding transforms complex data into really captivating visual essays. Their projects span from AI-powered music criticism to 3D population landscapes. For a masterclass in interactive storytelling, see their Hamilton visualization by Shirley Wu, where Broadway meets data art.
FiveThirtyEight
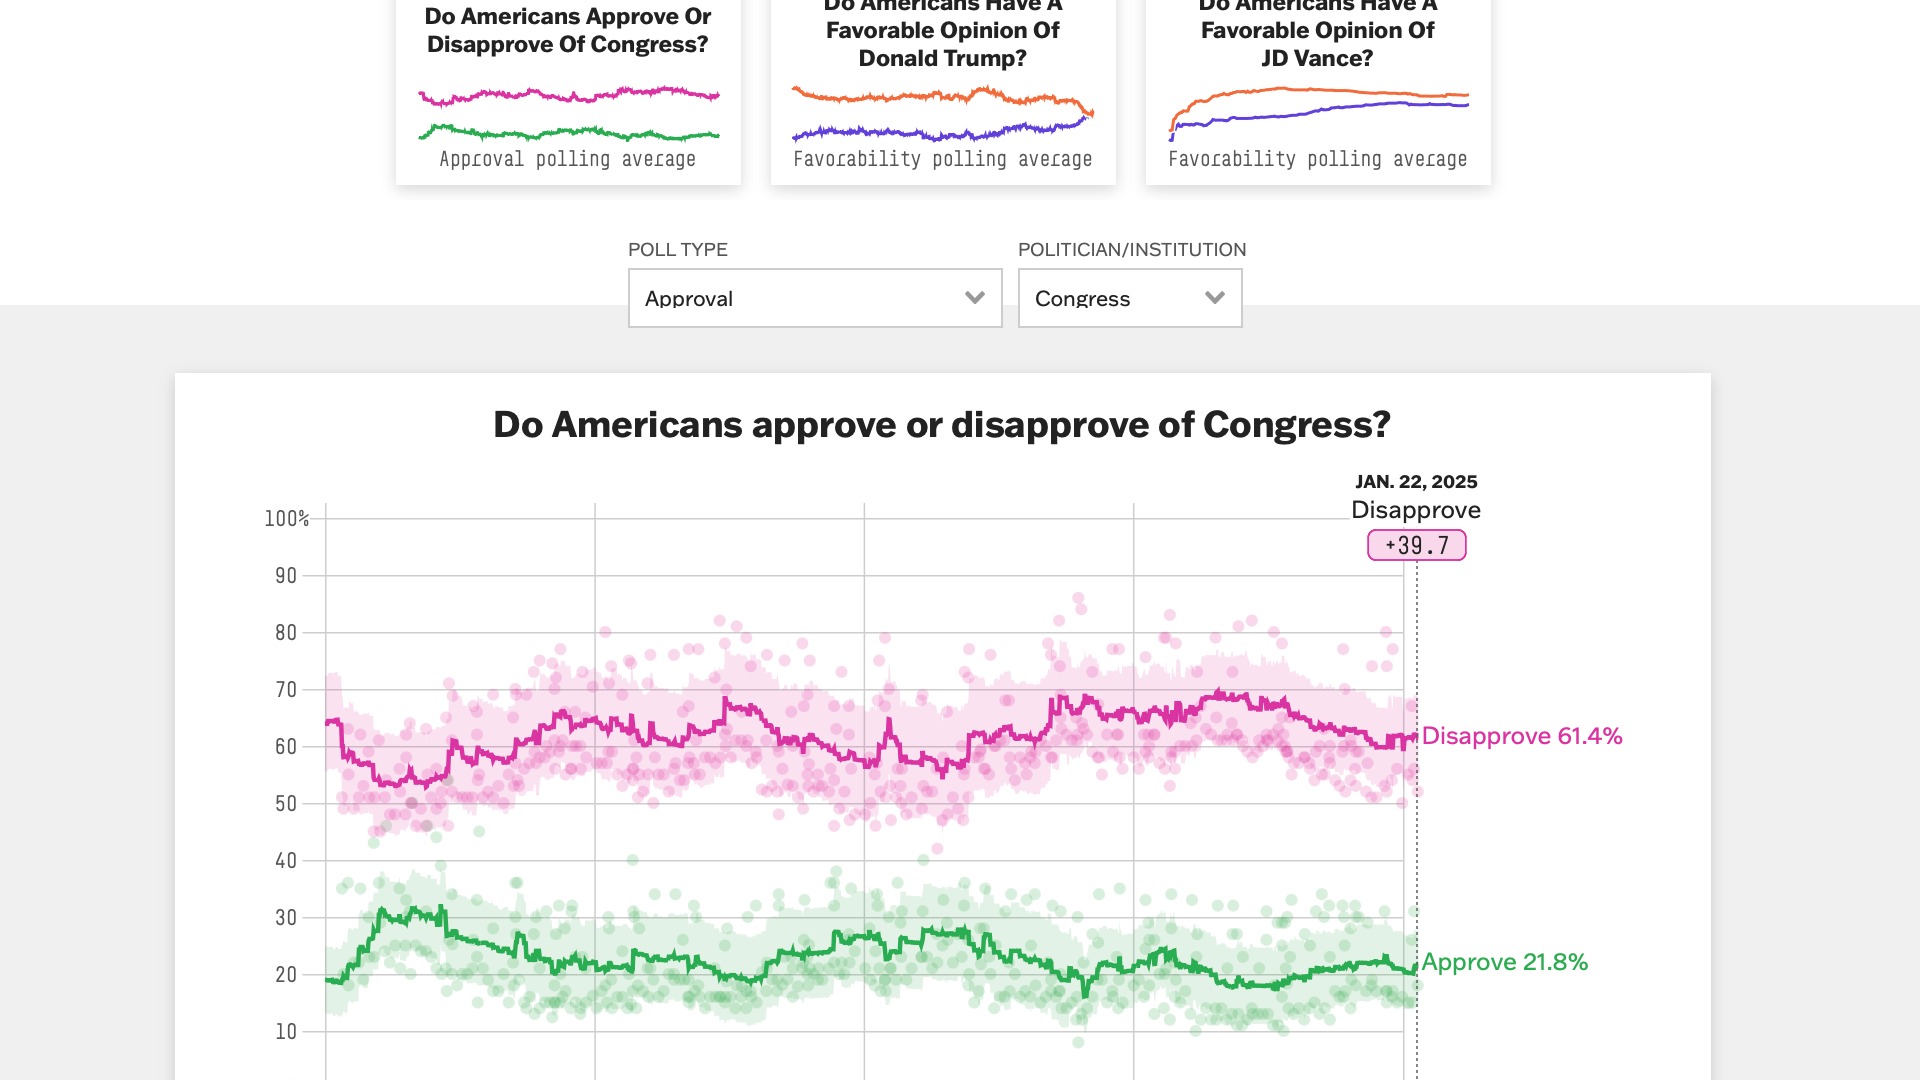
FiveThirtyEight, this is a classic! Founded by Nate Silver, their visualizations elegantly handle complex datasets, from their election forecasts to NBA player projections. Even seemingly simple topics like ranking Halloween candy become engaging data stories!
The Upshot (New York Times)
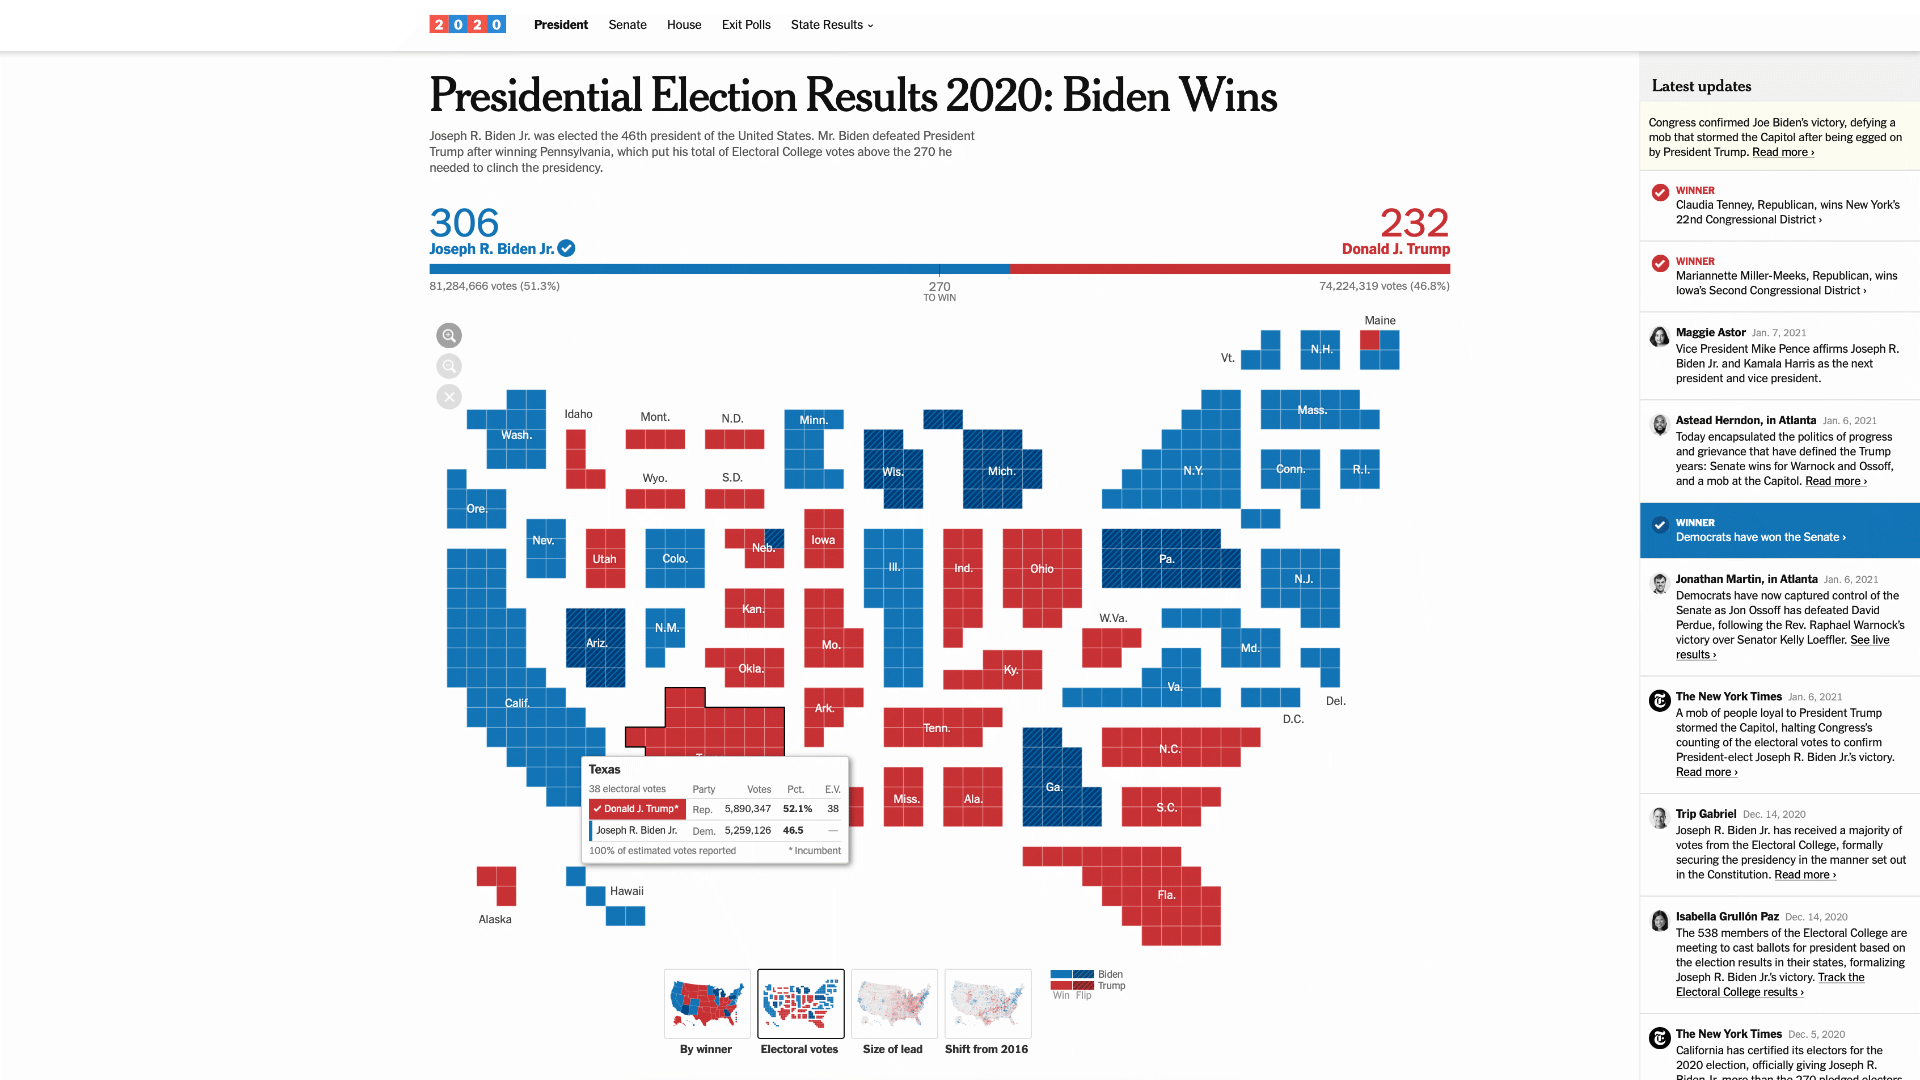
The Upshot is The New York Times' data journalism wing which is a real masterclass in making complex data intelligible through the web. Their work demonstrates how modern web technologies can turn dense datasets into explorable spaces, making them particularly valuable for developers looking to level up their data presentation skills.
Reuters Graphics
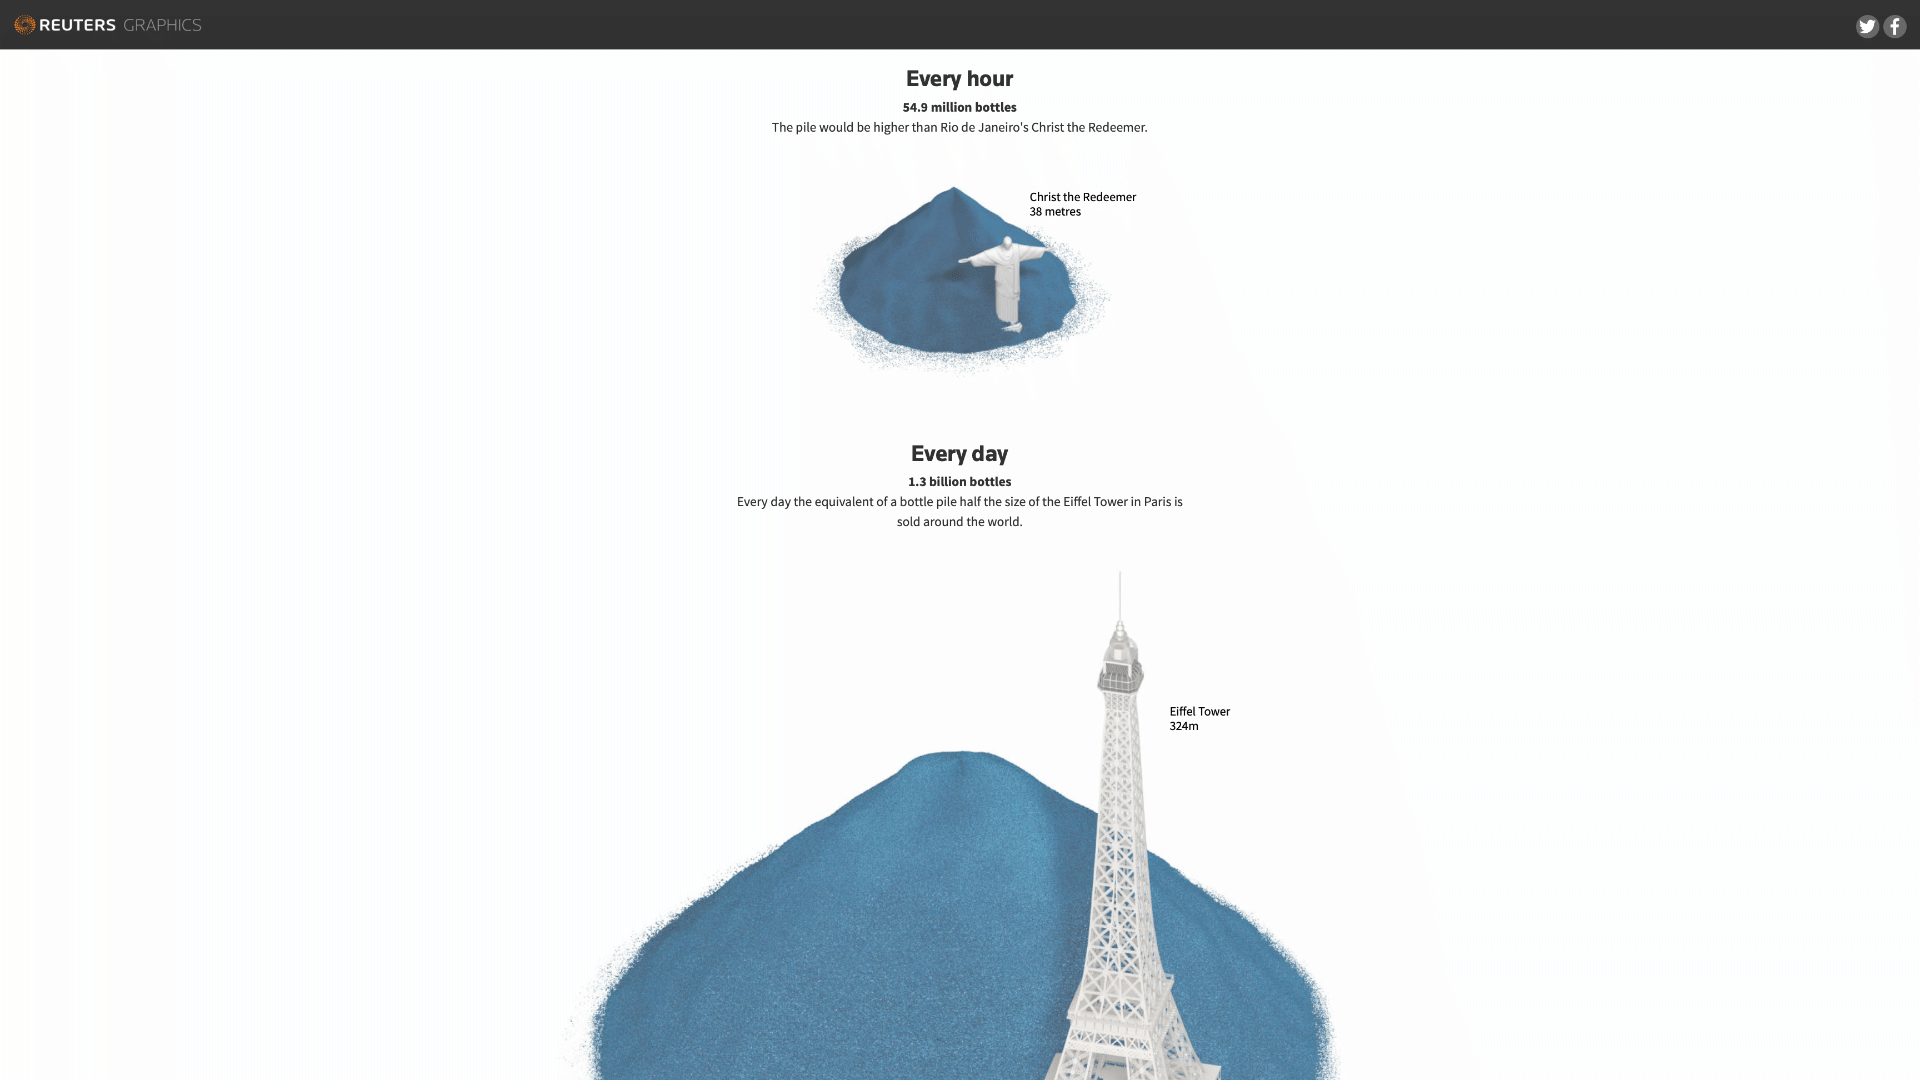
Reuters Graphics is really impressive. Their work, like Drowning in Plastic and the Tokyo Olympics coverage, are case studies in transforming dense information into explorable interfaces that reveal rather than overwhelm.
FlowingData
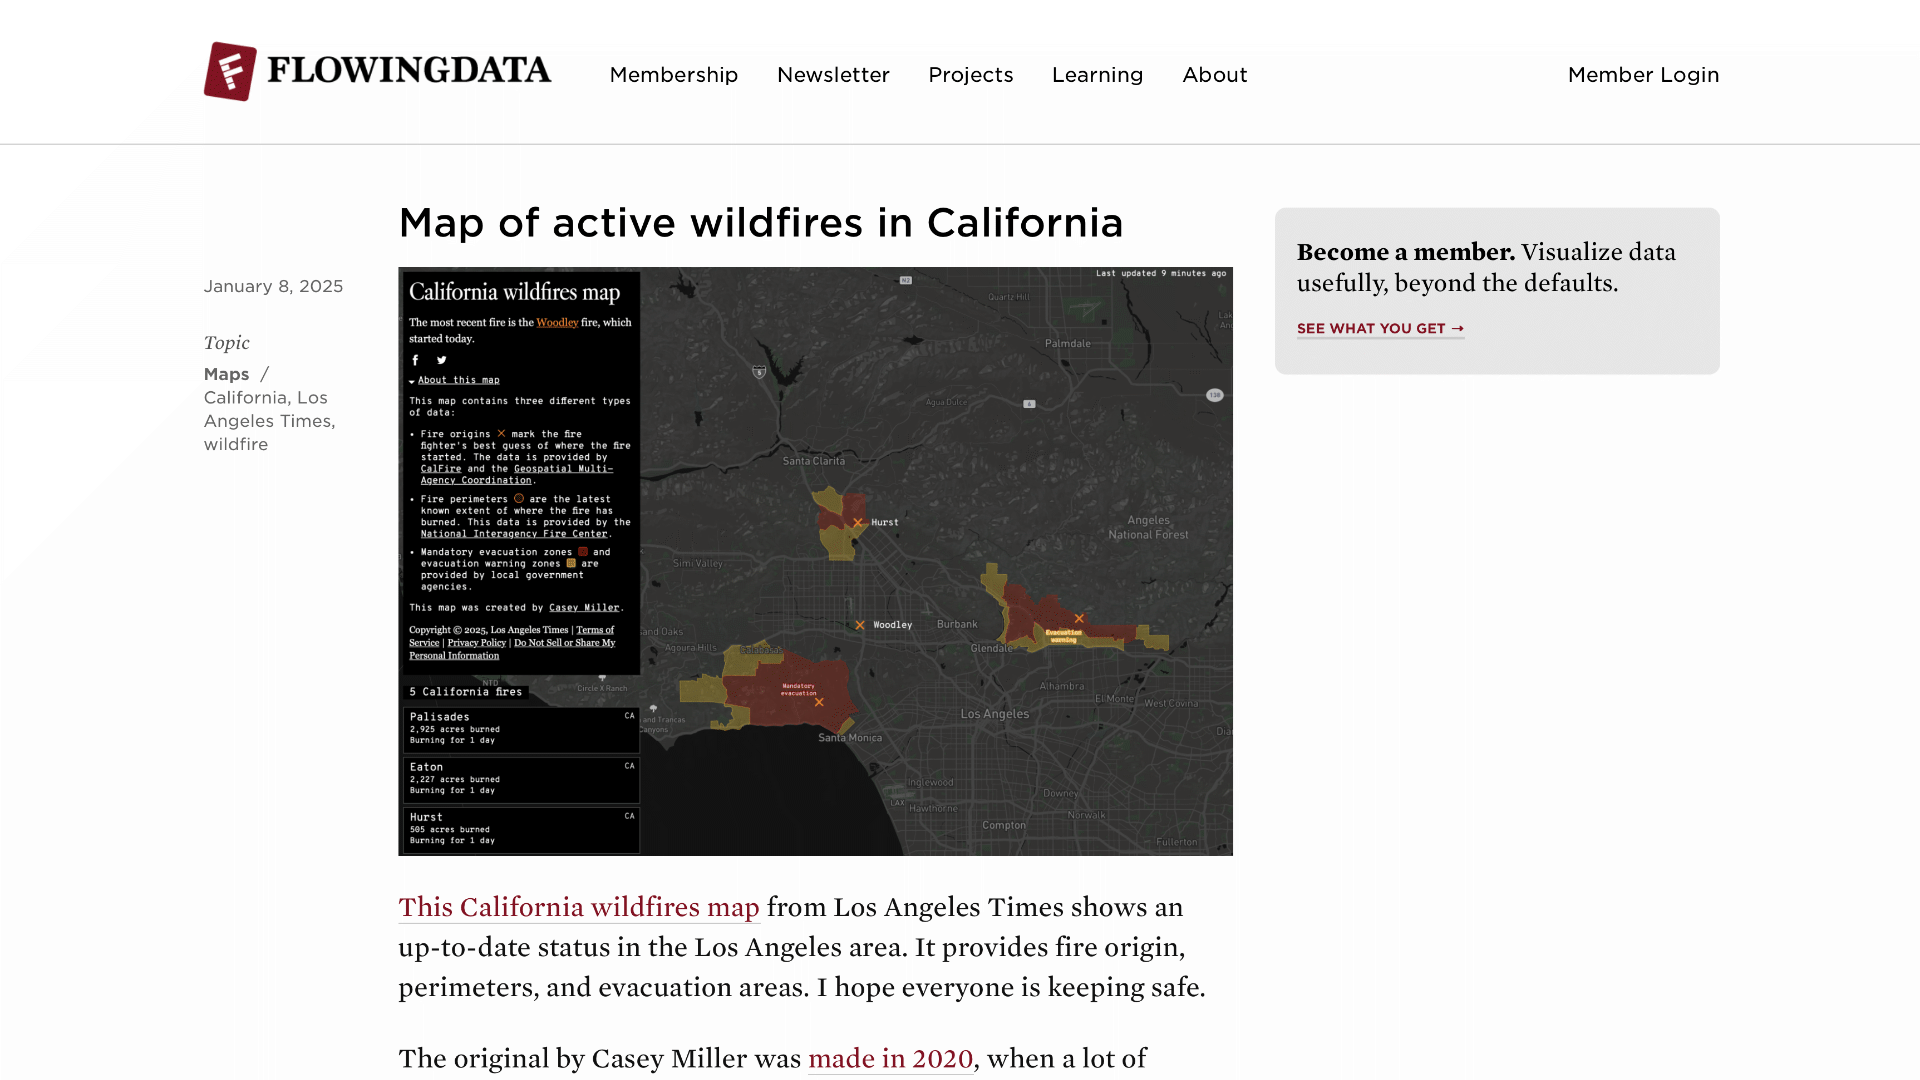
Nathan Yau's FlowingData - this really stands out to me as a learning platform and a source of inspiration for data visualization! I love the projects of the evolution of love songs and workforce participation trends. The site helps me think of what we can do to be a bridge between statistical thinking and visual design.
Financial Times: Visual and Data Journalism
Financial Times: Visual and Data Journalism division sets the standard for data design in financial media. Their projects, from the Ukraine War Tracker to the Global Inflation Tracker, demonstrate how complex financial and geopolitical data can be made explorable without oversimplification.
Their COVID-19 Dashboard became particularly notable for showing how real-time data visualization can serve a critical public need while maintaining visual sophistication.
Information is Beautiful Awards
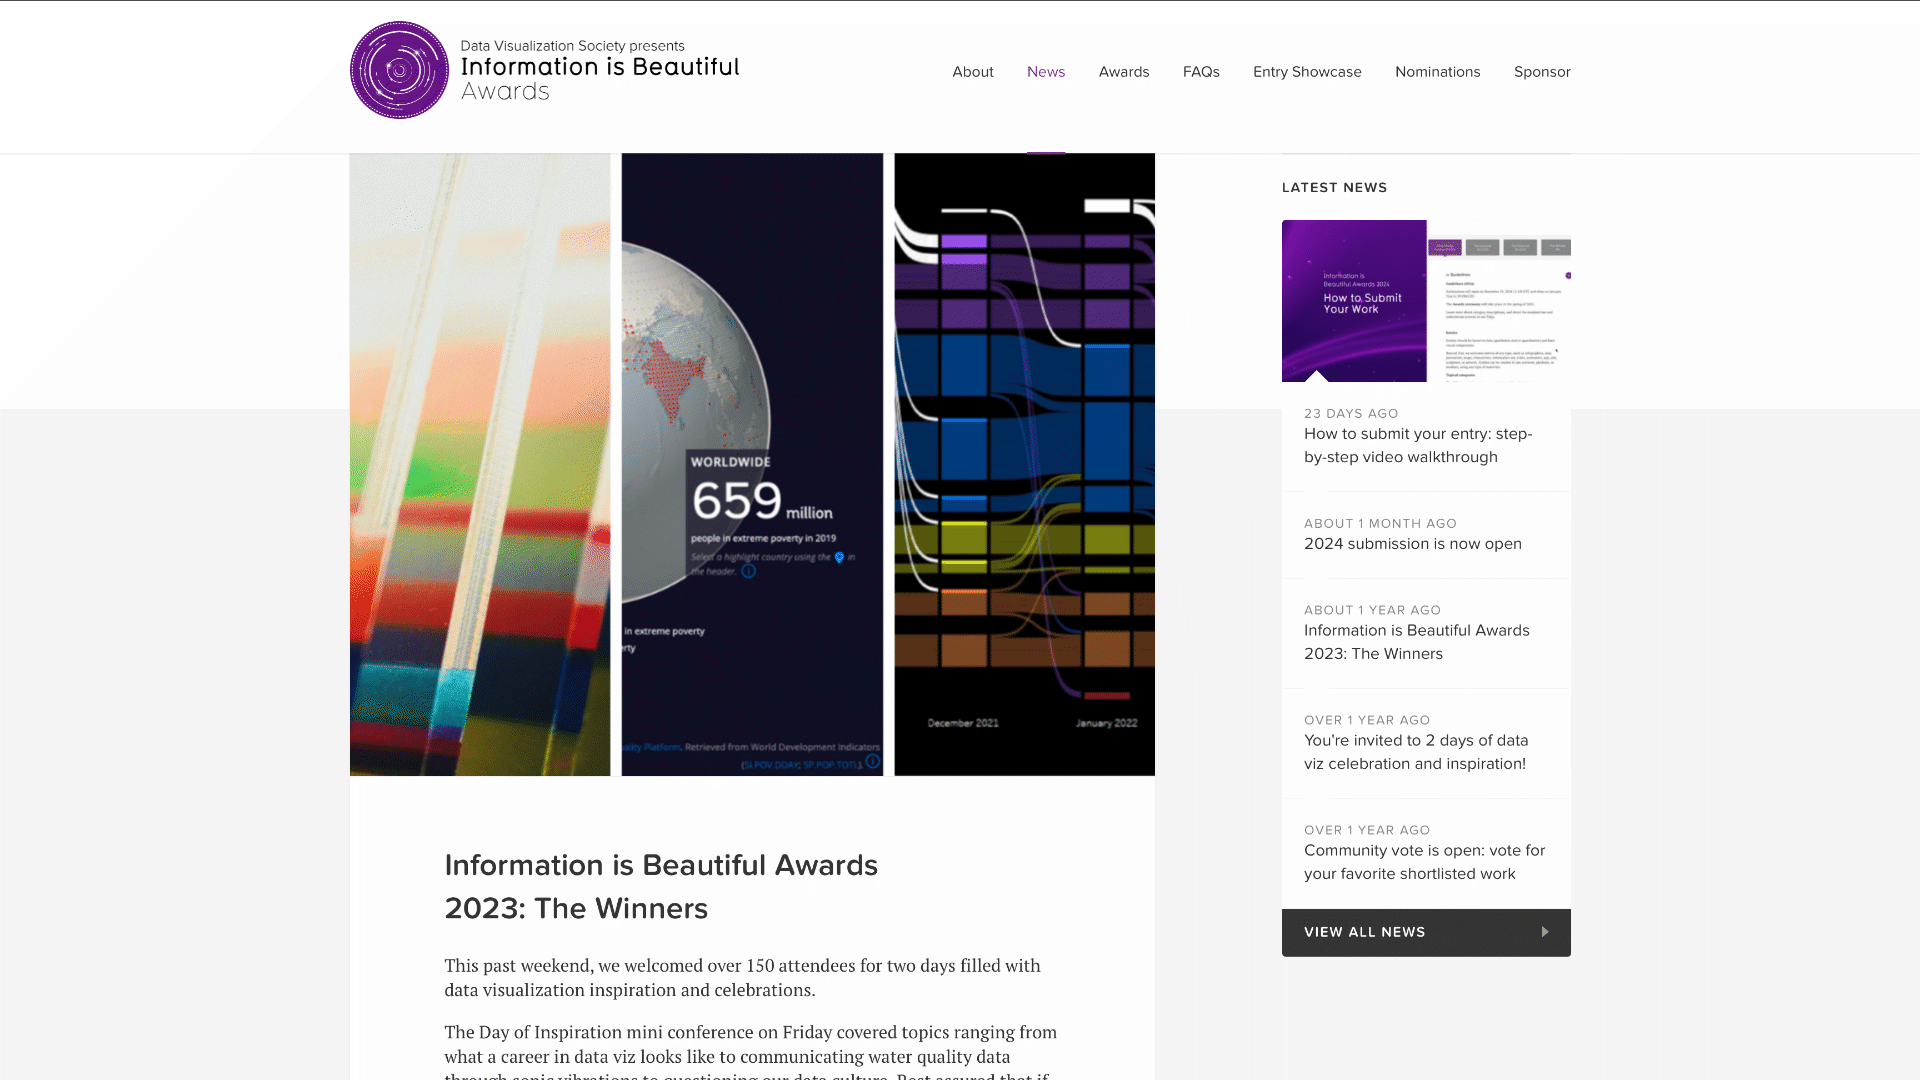
Information is Beautiful Awards - these awards have been around since 2012 and is a great living archive of data & design.
Their 2023 winners are just amazing examples of inspiration: basketball, insects, shadowy borders and toxic dust - it's all there!
Not to be confused with...
r/dataisbeautiful
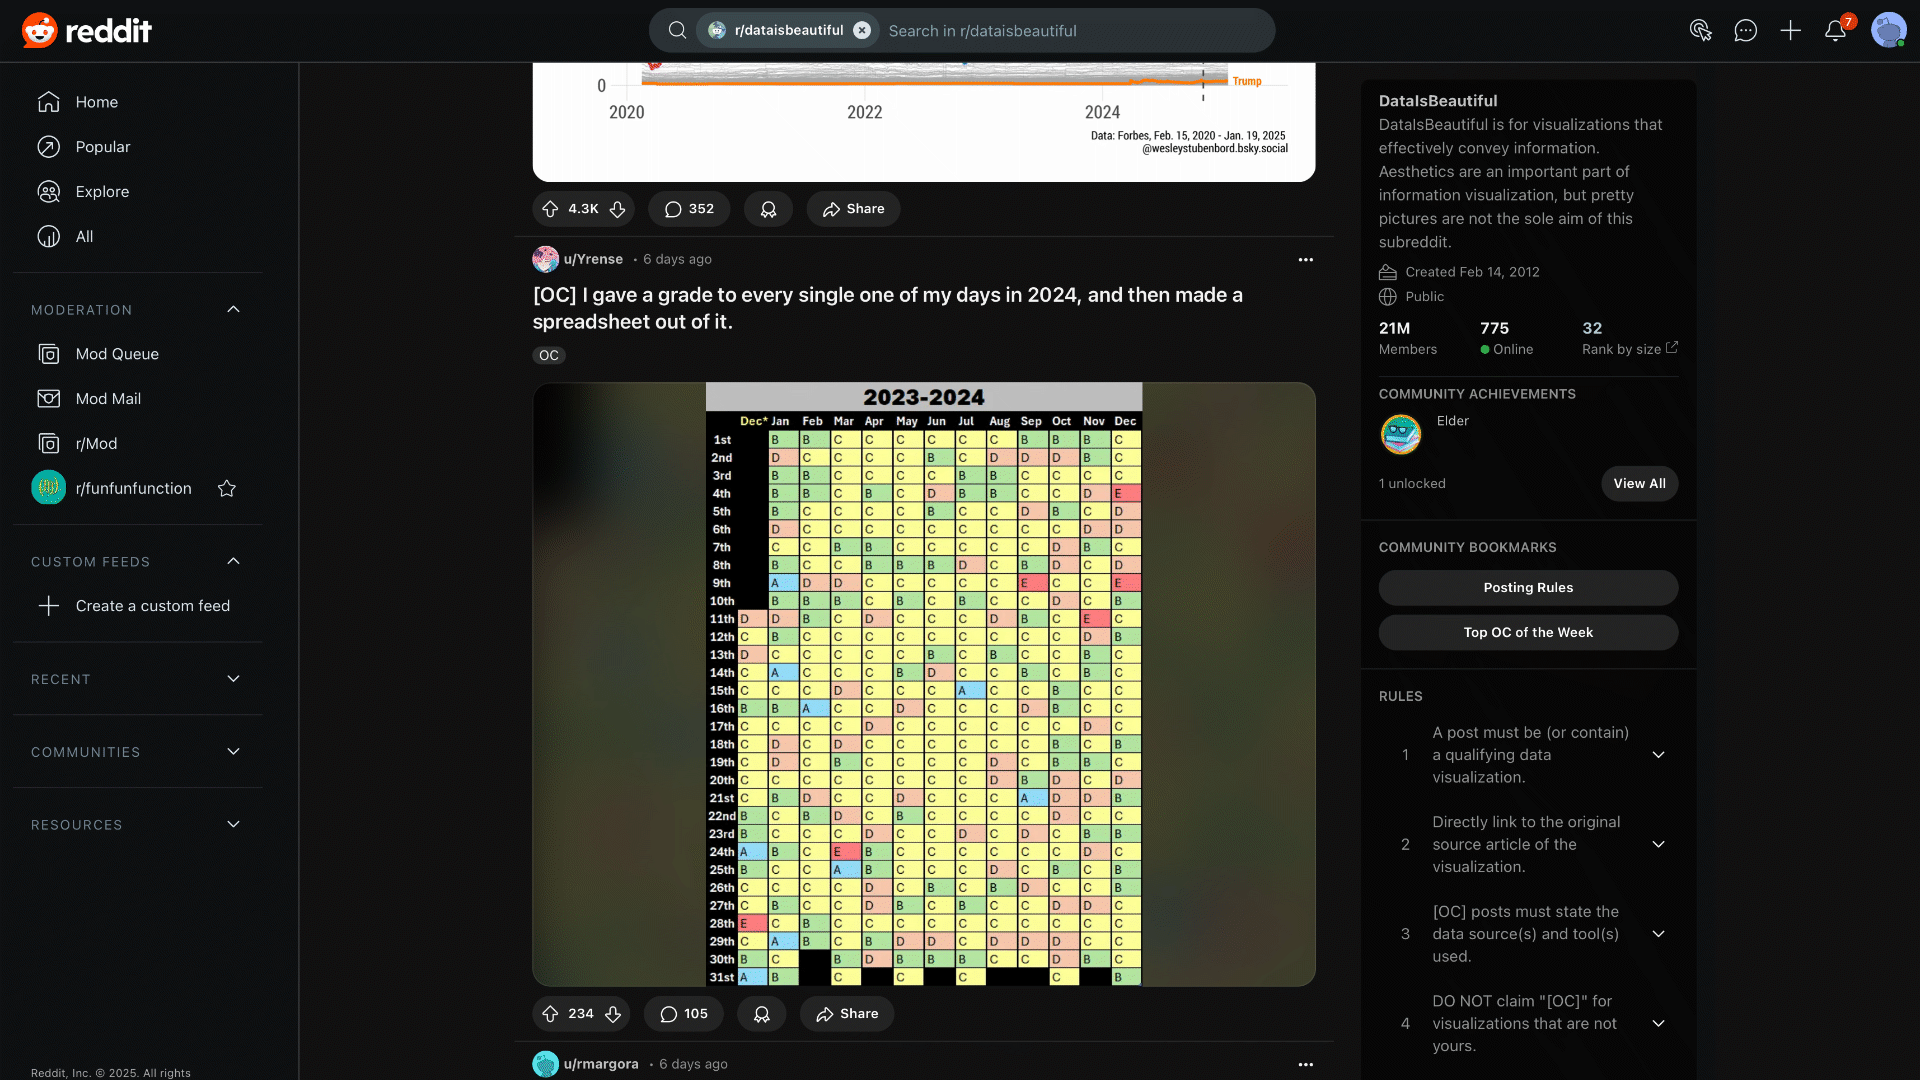
With over 20 million members, the r/dataisbeautiful subreddit is really a window into the experimental edge of the field - this is where creators test new things and occasionally stumble upon entirely new ways of seeing data. For web developers, it's particularly valuable as a space to observe how different technical approaches resonate with a general audience. This is where you can see real-time feedback on what makes data visualization truly accessible and engaging.
Domestic Data Streamers
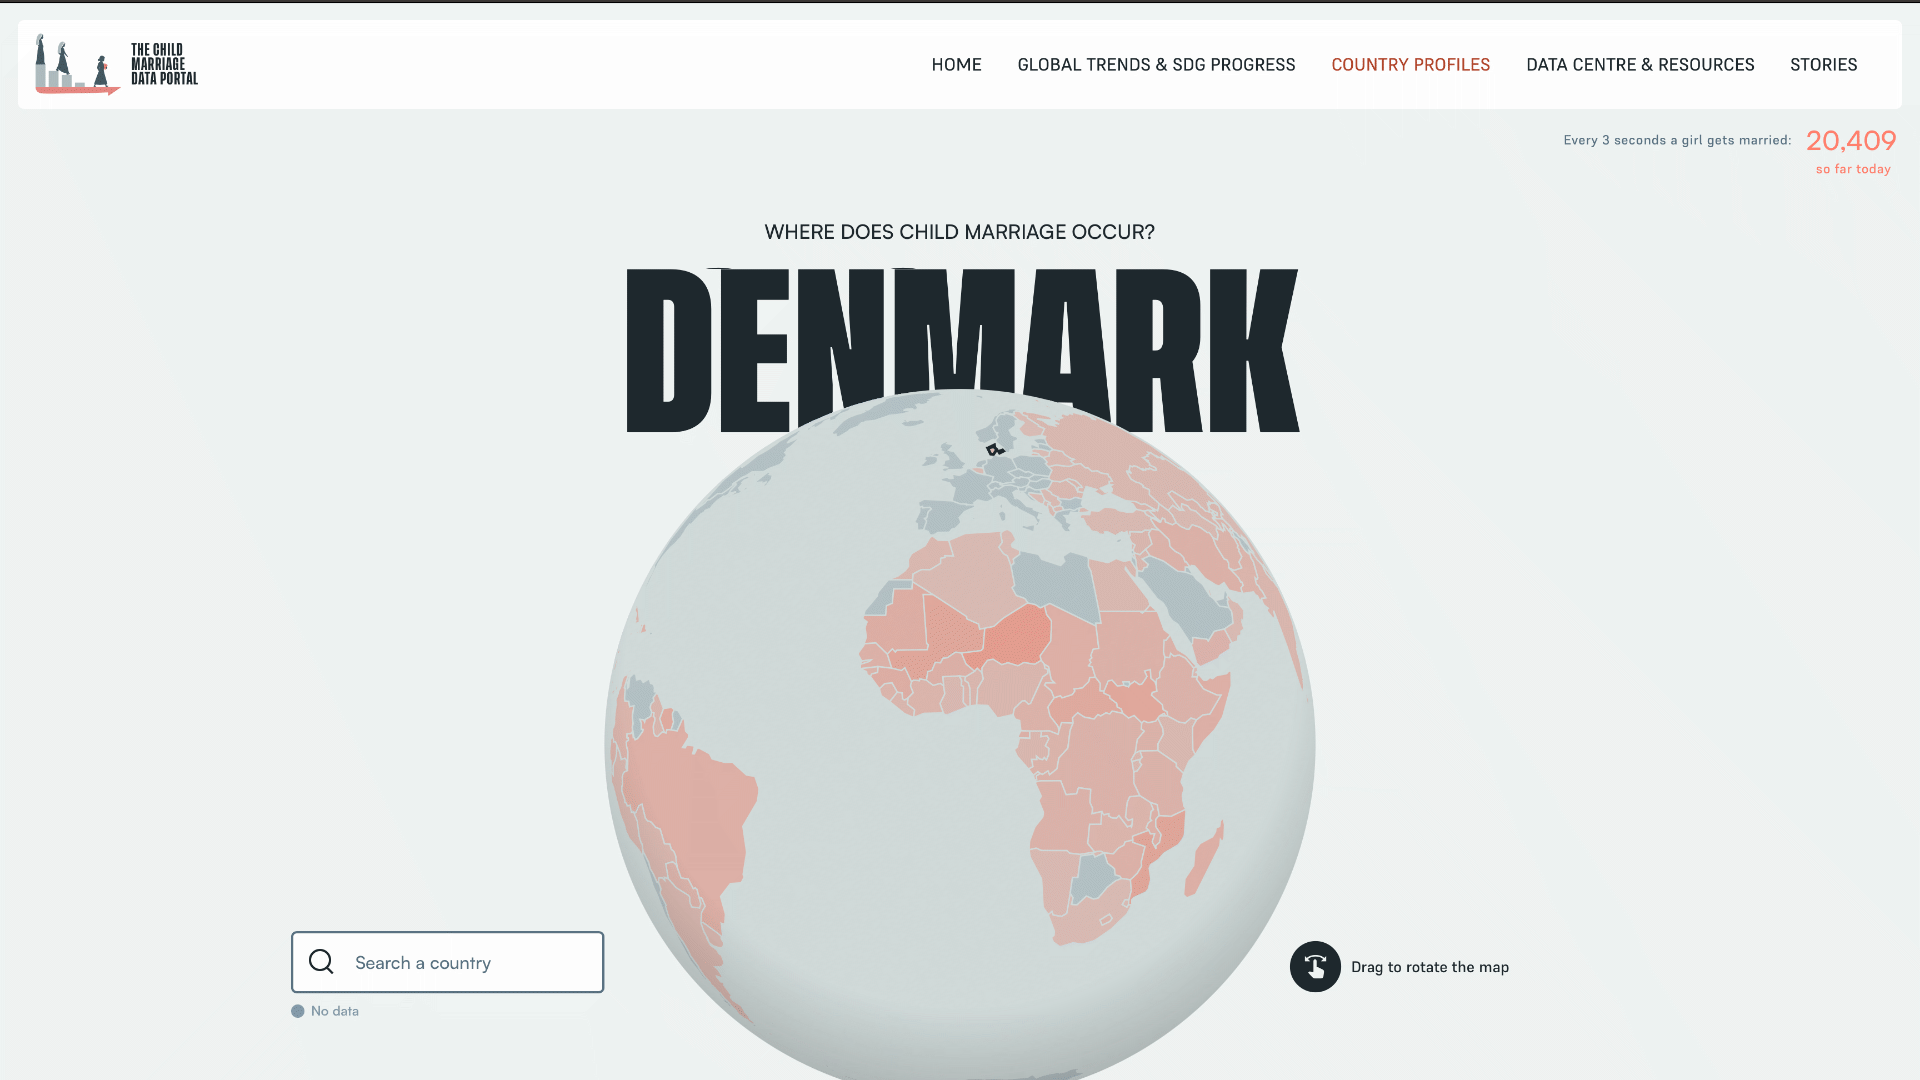
At Domestic Data Streamers they craft installations and interfaces that literally go beyond the screen. Their work, spanning from AI-driven memory reconstruction to the Child Marriage Data Portal, show how data visualization can extend beyond traditional web interfaces into physical and hybrid spaces. For developers exploring data's potential, their project Everything that is not eaten is a perfect example of an immersive data experience.
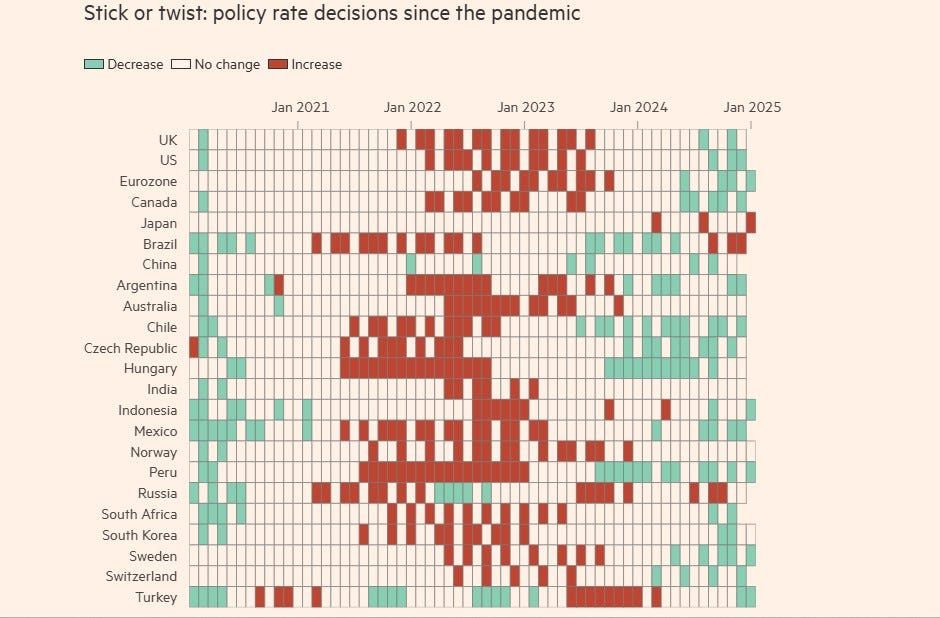
Graphic Detail (The Economist)
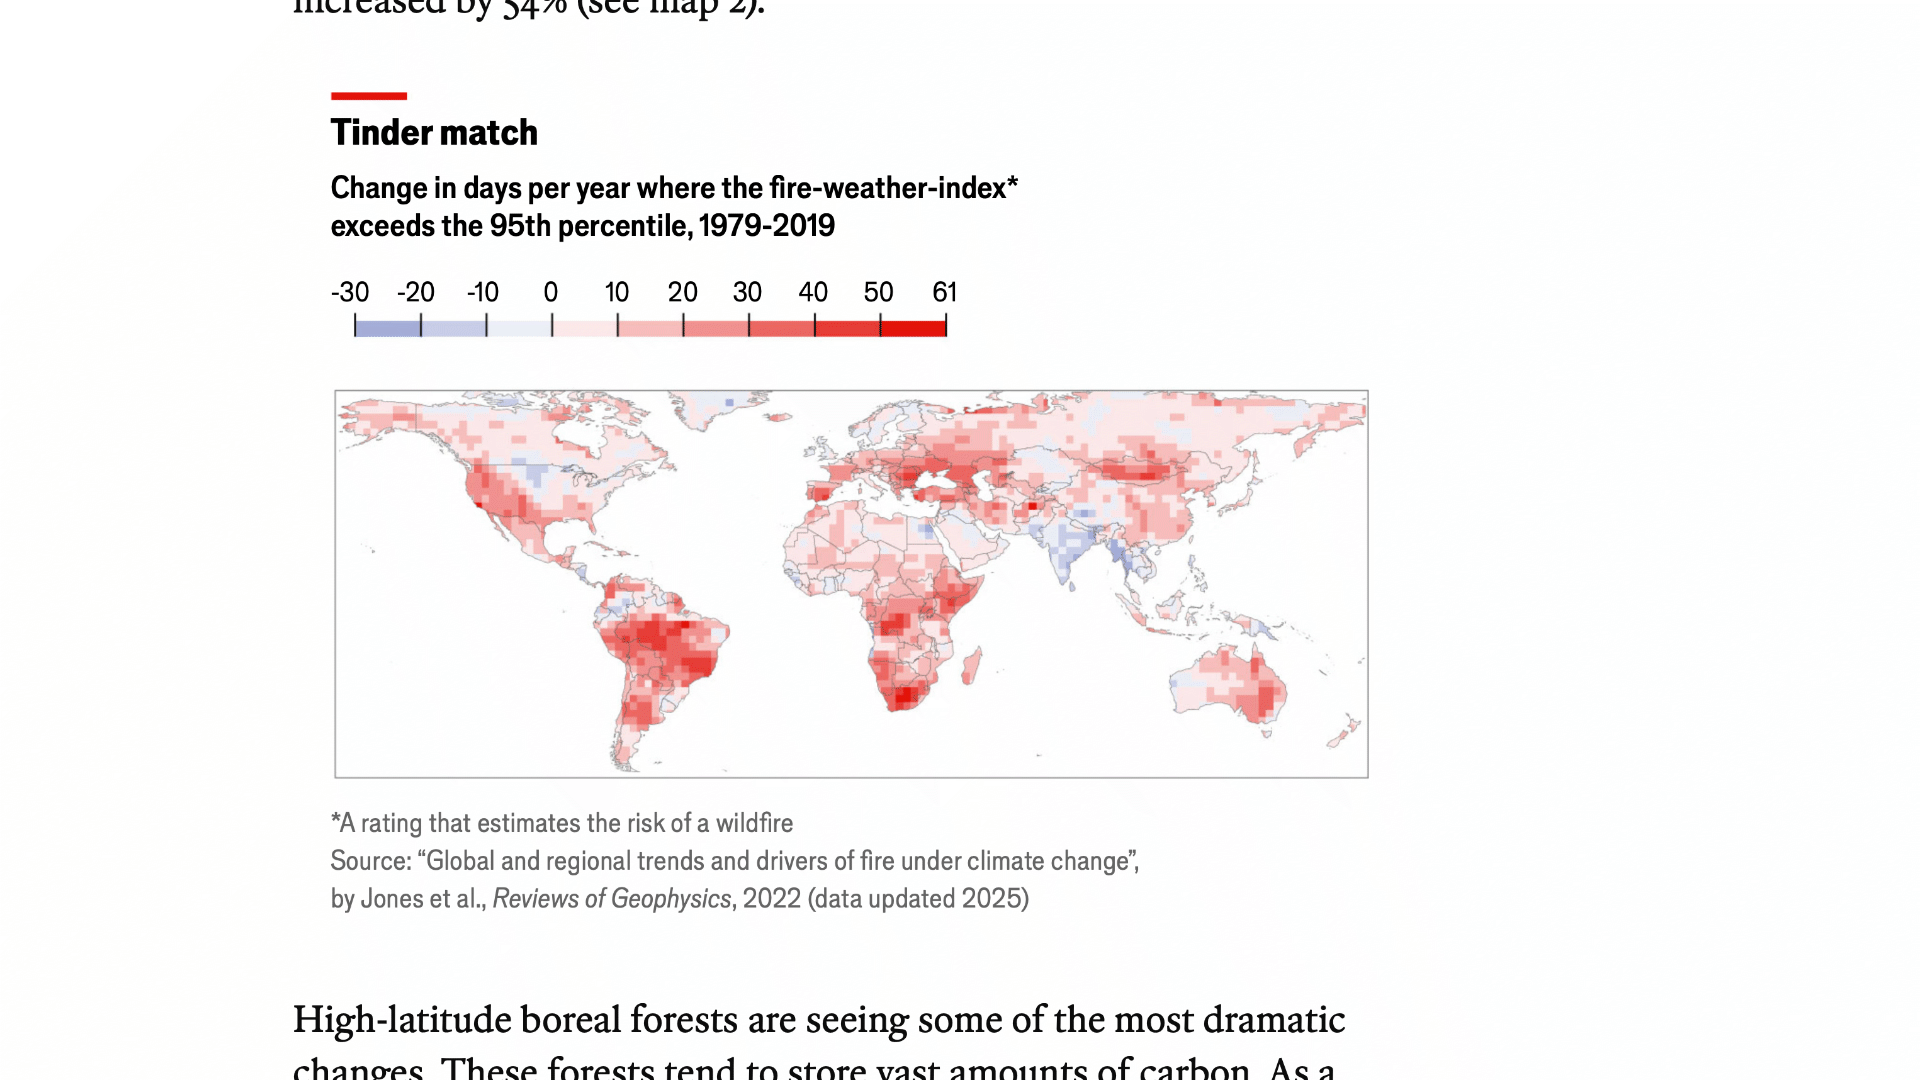
Graphic Detail, is the Economist's data journalism wing. Their work ranges from rapid-response analysis like wildfire trend mapping to deep system explorations, like their landmark Sun Machines piece on solar energy's exponential growth. Their reflection on their first year reveals the rigorous methodology behind their seemingly effortless clarity.
DataPhys.org
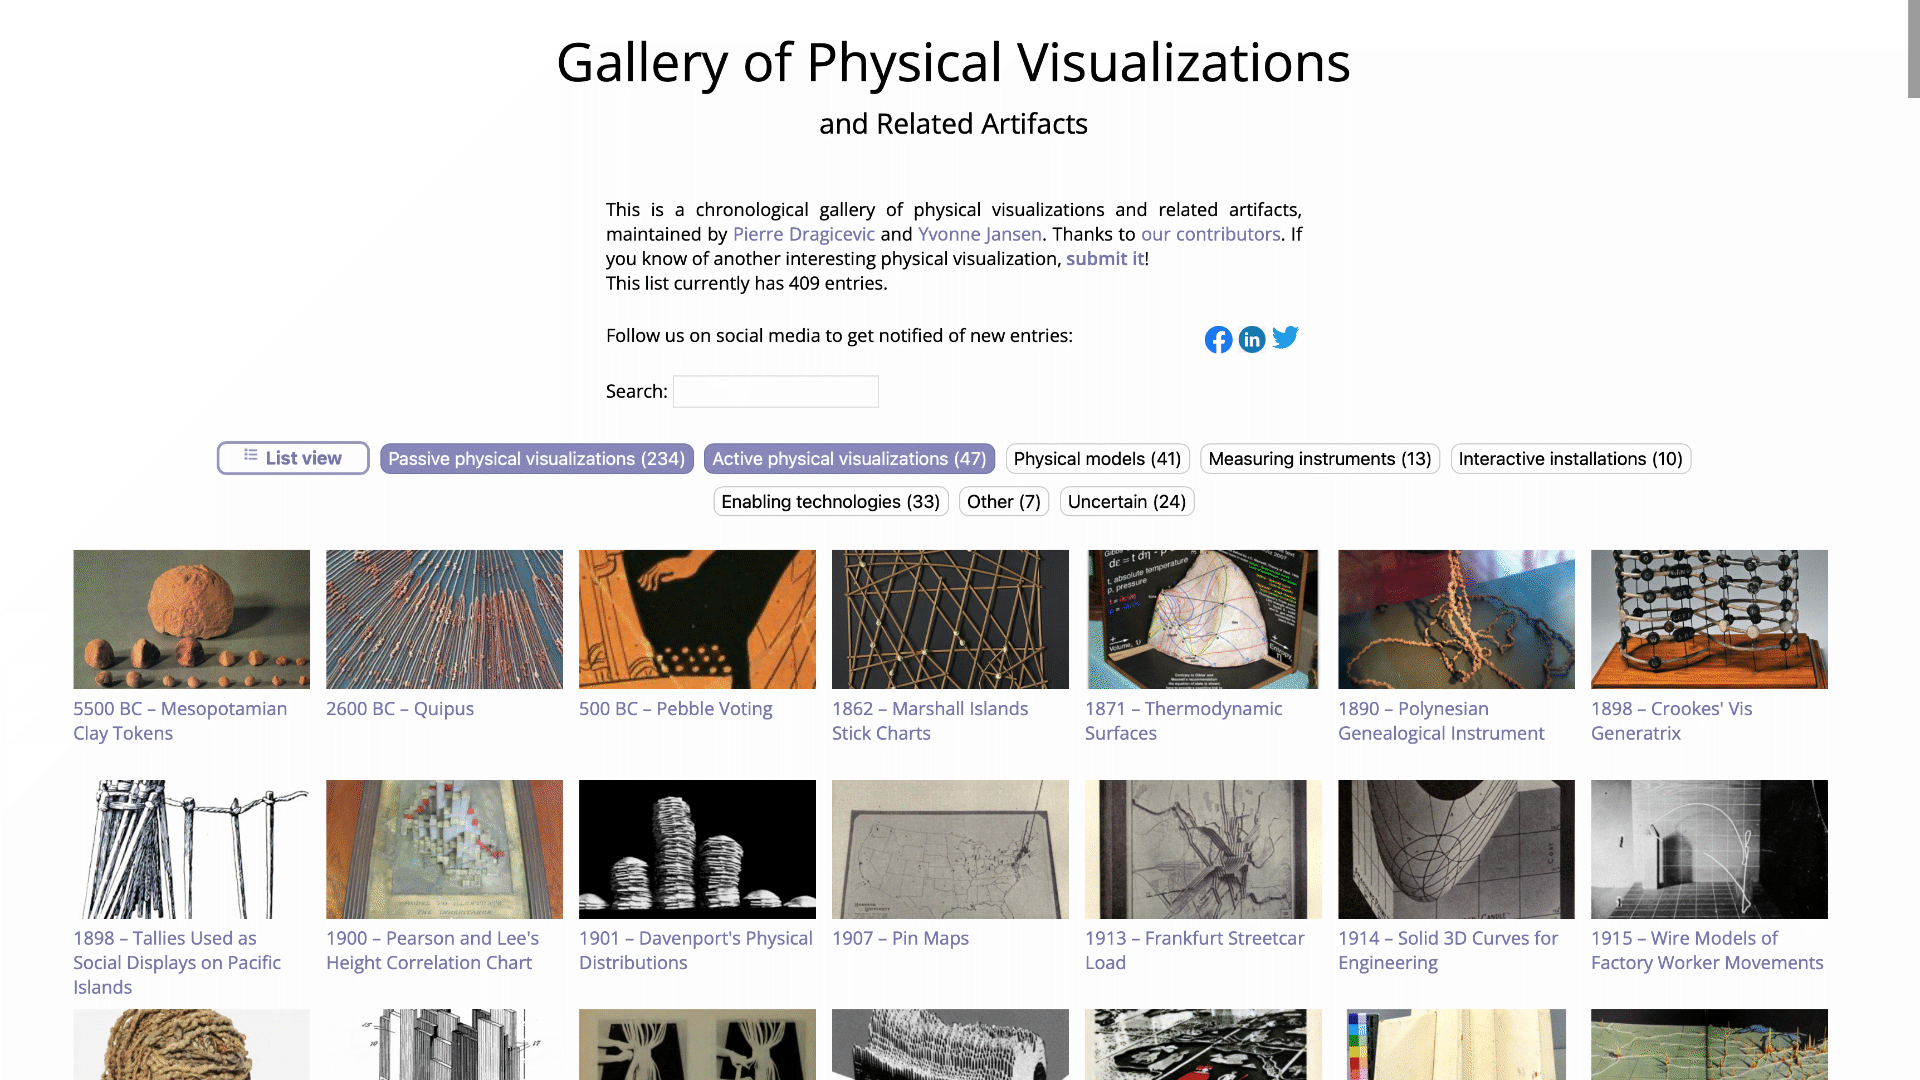
DataPhysicalization.org documents how information can take physical form. Their List of Physical Visualizations is both historical archive and inspiration gallery (at least for me!). They also have extensive resources on enabling technologies if you are ready for a new hobby or side project. This includes a comprehensive bibliography and teaching materials.
Observable's Data Visualization Ecosystem
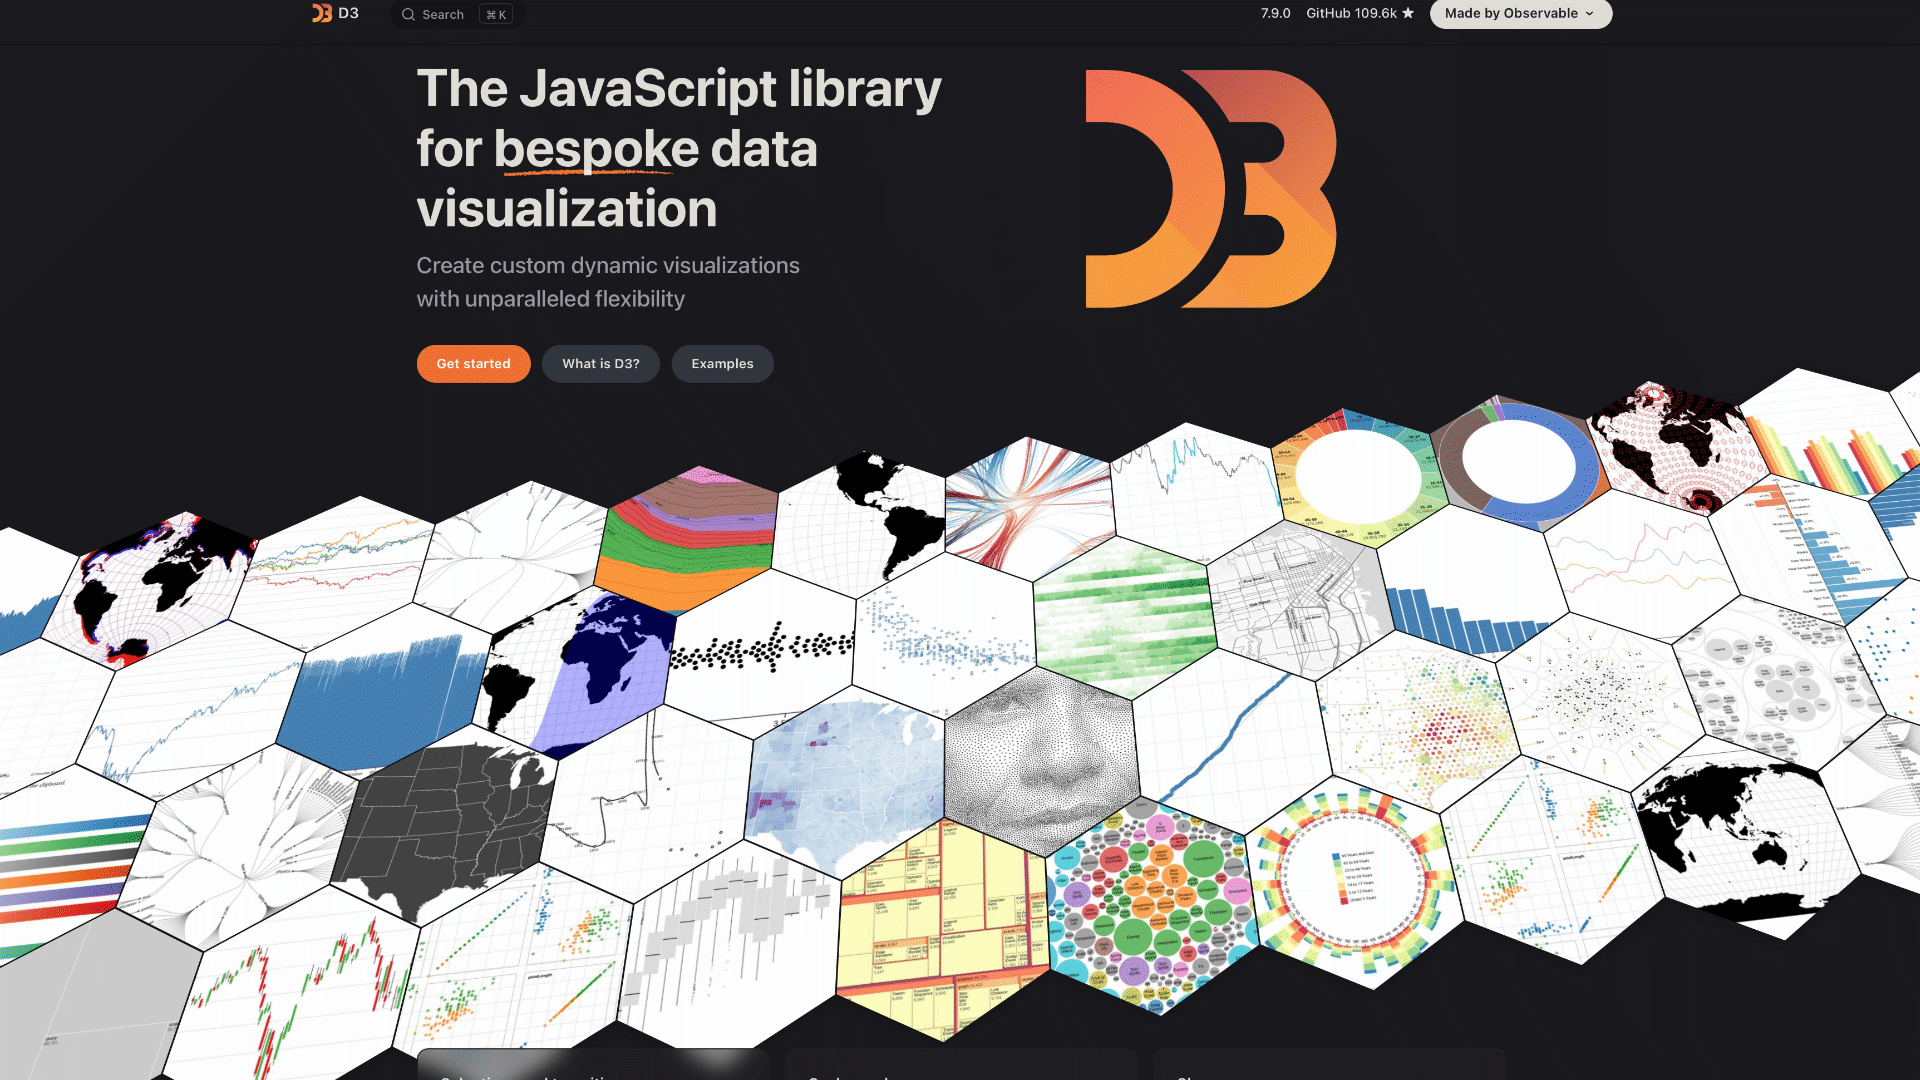
Observable, founded by Mike Bostock (the creator of D3.js) and Melody Meckfessel, really represents a paradigm shift in how we approach data visualization development.
Unlike traditional IDEs, Observable introduces a reactive notebook environment that transforms the typically isolated process of visualization development into a living, breathing ecosystem of collaborative exploration. This fundamental reimagining of the development environment has made it the de facto platform for modern data visualization prototyping.
At the heart of this ecosystem lies three interconnected galleries that showcase the platform's capabilities. The Trending Notebooks section serves as a dynamic window into the community's collective exploration, highlighting notebooks that range from practical utilities to experimental visualizations. These trending examples often reveal emerging patterns in data visualization practice, offering insights into both technical implementation and design thinking.
Meanwhile, the Observable Plot Gallery demonstrates the power of Observable Plot, a high-level visualization library that strikes a careful balance between the simplicity of declarative charting libraries and the expressiveness of D3.js. Plot's gallery serves as both documentation and inspiration, showing how complex visualizations can be created with remarkably concise code.
The D3.js Gallery, curated by Bostock himself, stands as a masterclass in data visualization implementation. These examples, ranging from basic chart types to complex interactive visualizations, demonstrate not just what's possible with D3.js, but how to think about decomposing visualization challenges into manageable pieces. The gallery's examples are particularly valuable because they showcase D3's latest capabilities within Observable's reactive environment, offering insights into modern best practices for visualization development.
Together, these three galleries form a crazy comprehensive learning environment that caters to different levels of expertise and different approaches to visualization development. You havve Plot's high-level abstractions all the way to D3's low-level control. You can look at community experiments as well as polished examples. It's just a full spectrum of approaches to data visualization. For web developers venturing into data visualization, this ecosystem has both copy-paste examples and deeper learning opportunities. Can you tell I like it?
Take it easy this Monday... Or not.

I hope you are having a more energy-filled start to your week than mine, but hey, sometimes we are just tired, and I'll go get some of that zzzz now and roar back into the week rested.
As always, stay curious 🧐🐒
Mattias Petter Johansson