
The slow cartography movement and a bearded cajun grandma
A four-year map projection, a no-AI org chart study, and a New Orleans chef who cooked the same meal for decades.

The slow cartography movement and a bearded cajun grandma
This week, three stories caught my eye.
A cartographer spent four years implementing a projection he thought would take a weekend.
A systems scientist extracted networks from hundreds of corporate organization charts using no AI—just "two human brains and a laptop."
A New Orleans chef hosted Monday night dinners with exactly the same menu for decades, creating one of the city's most vibrant communities.
It's always hard to know why certain stories touch us, and quite honestly, it's almost always a post-rationalization - however, I do think a word that connects these three is "narrow".
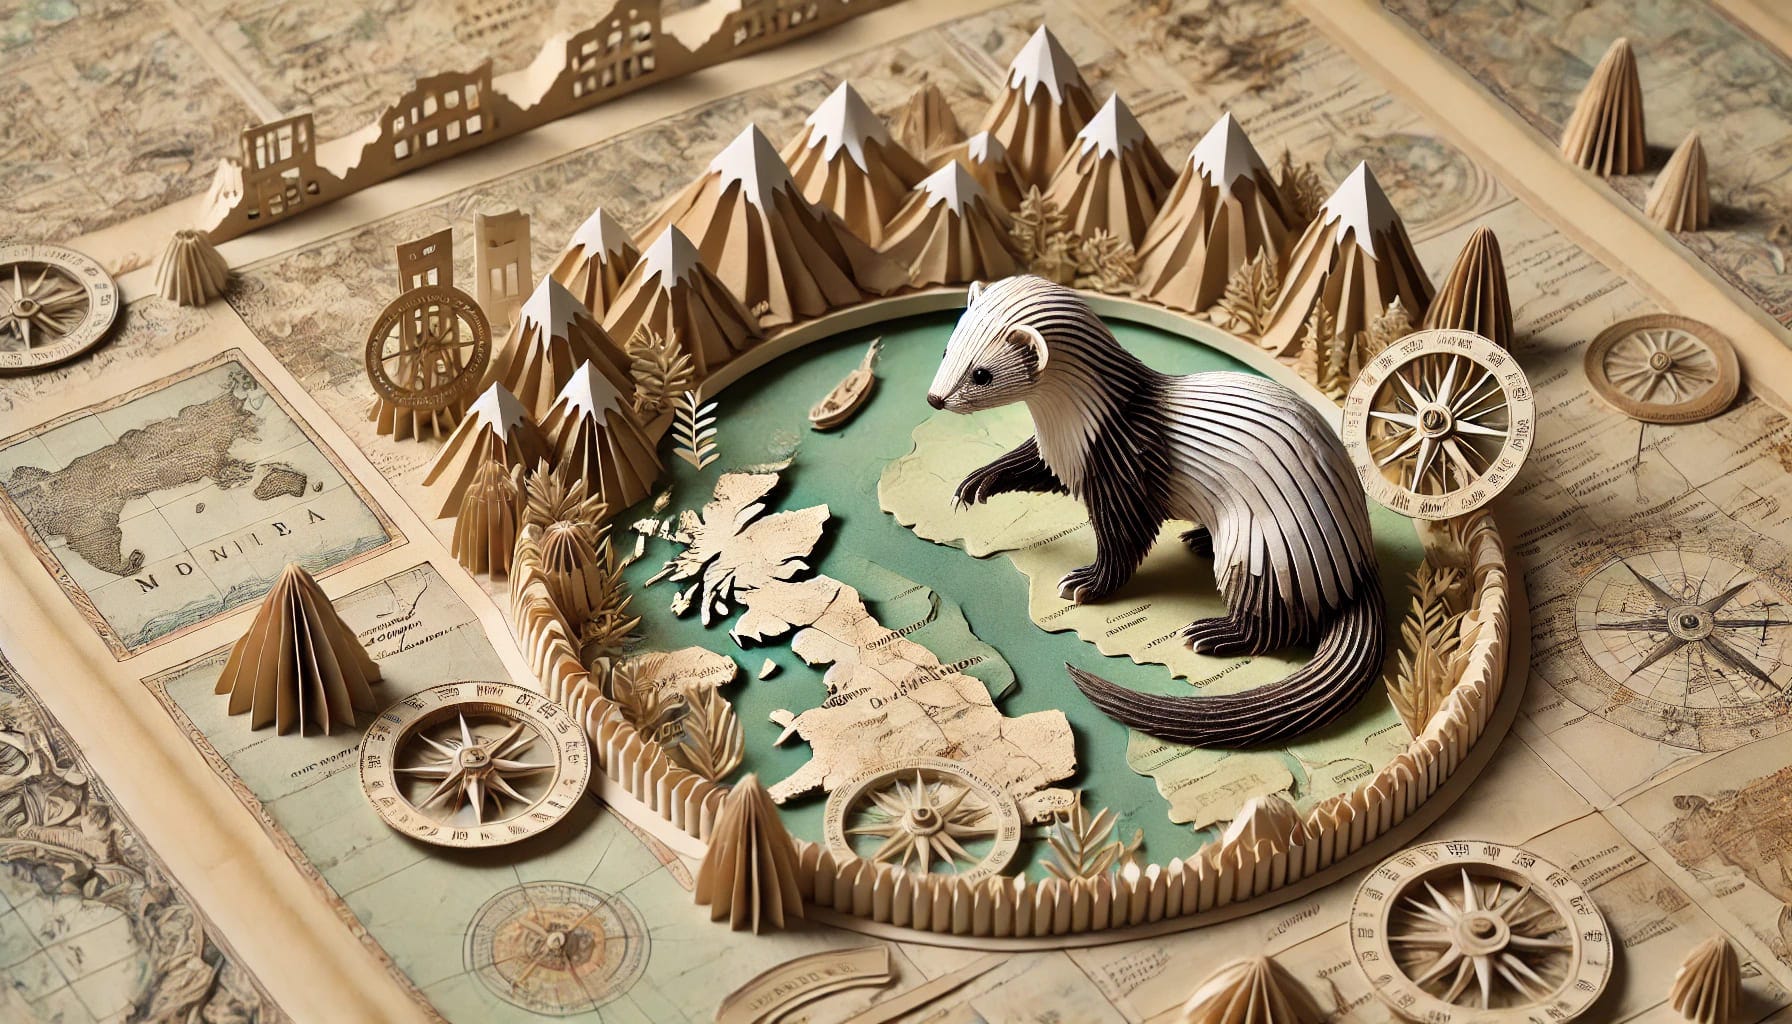
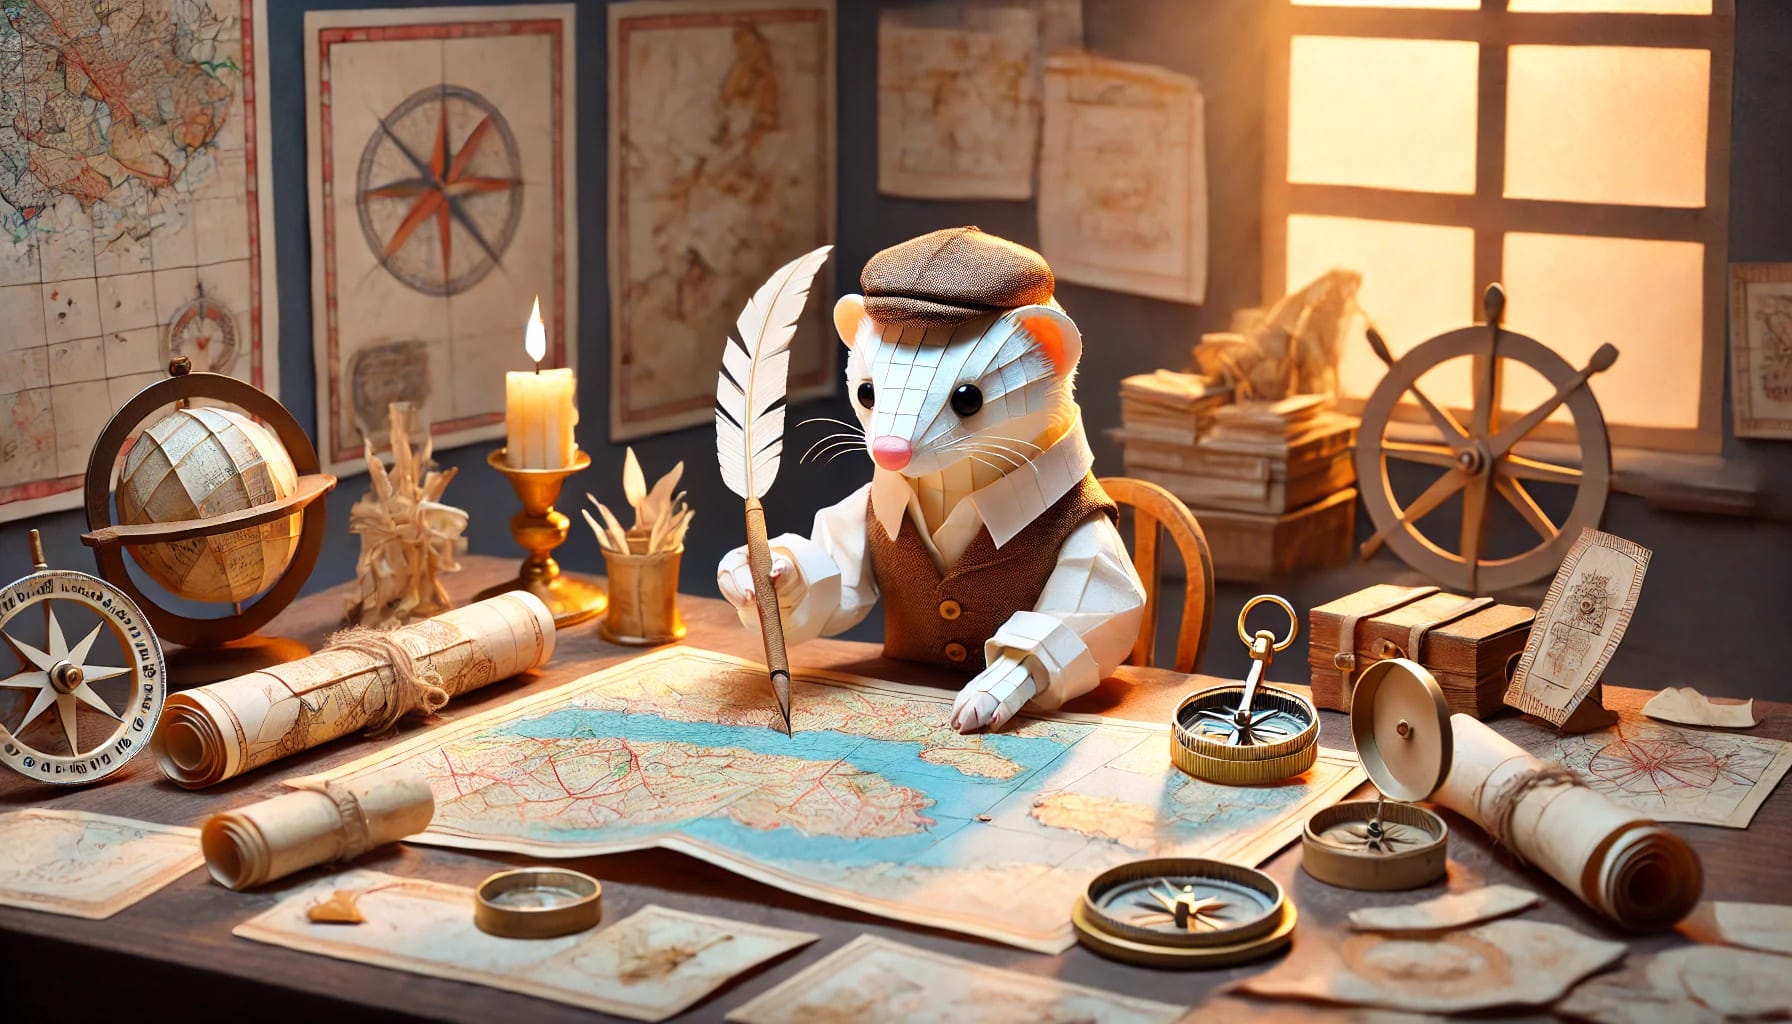
The Cartographer's Patience: The Tale of the Bertin Projection
"I thought that automating the Bertin projection by computer code would be a weekend project. It took me around 4 years."
That is a little tidbit mentioned by Fil Rivière (posting on Bluesky as @fil.rezo.net) when interviewed in “We can always talk about maps”, an absolutely mind-bogglingly dense AMA with him on the Observable Blog.
In case you aren’t super into maps, you might think it alien that one would spend 4 years on that, so let me go into some background.
Aaron Sorkin leveraged The West Wing to edify his audience around various niche matters, and one of the best examples of this is a scene where he highlights how much the Mercator projection is the most common way of showing the world, but just isn’t very truthful.
This is a rather vast subject out of the scope of this chronicle, but if it piques your interest, I suggest What This 3-Minute Scene From ‘The West Wing’ About Maps Can Teach You About Leadership on Forbes.
Jacques Bertin was a French cartographer and theorist who revolutionized information visualization in the 1960s. His seminal work, "Semiologie Graphique" (The Semiology of Graphics), published in 1967, established fundamental principles for data visualization that we still use today.
Bertin developed a unique map projection that prioritized showing relationships between regions rather than precise geographic locations.
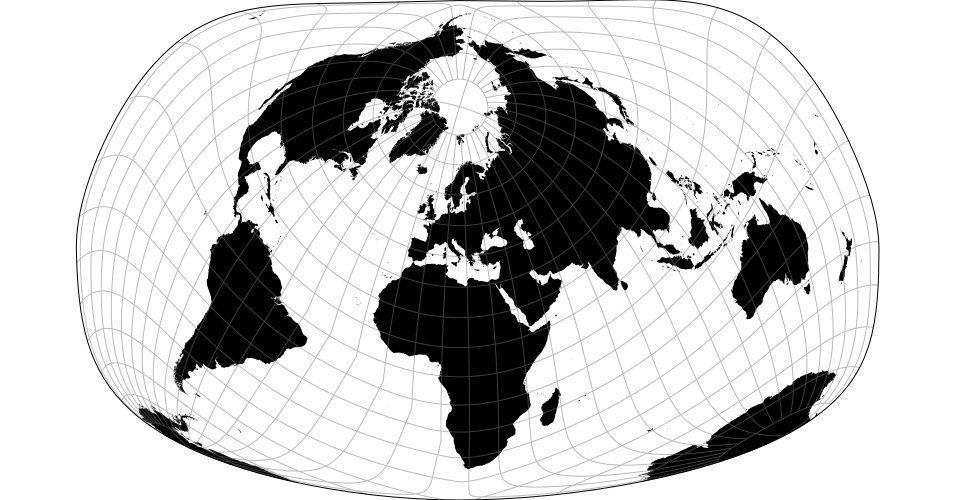
Unlike the Mercator projection (which preserves angles but distorts size dramatically near the poles) or the Peters projection (advocated by the characters in the West Wing episode, which preserves area but distorts shape), Bertin's approach focuses more on being conceptually correct - it preserves almost all of earth’s surfaces without distorting continents too terribly, and instead pushes distortion to the oceans.
Bertin would manually redraw maps to emphasize the data relationships he wanted to highlight—essentially treating cartography as an act of visual communication rather than geographic precision. His maps often looked "wrong" to the traditionally trained eye but revealed patterns that conventional projections obscured.
Bertin's maps embodied what he called graphic permutation - the ability to reorder visual elements to reveal patterns that would otherwise remain invisible. His matrices and reorderable matrices (what he called "dominos") allowed mapmakers to physically rearrange geographic data to discover correlations and structures.
Bertin would manually redraw maps to emphasize the data relationships he wanted to highlight—essentially treating cartography as an act of visual communication rather than geographic precision. His maps often looked "wrong" to the traditionally trained eye but revealed patterns that conventional projections obscured.
Bertin's maps embodied what he called "graphic permutation" - the ability to reorder visual elements to reveal patterns that would otherwise remain invisible. His matrices and reorderable matrices (what he called "dominos") allowed mapmakers to physically rearrange geographic data to discover correlations and structures.
As I was looking into Bertin, I found this gem of an interview with the late Jacques Bertin on WaybackMachine originally published on infovis.net, but now saved by WaybackMachine).
Interviewer: Your book “Semiologie Graphique” was published well before the boom of personal computing and computer graphics. Nevertheless the avalanche of data present in Internet and the impulse that computers have provided to visual communication mean that many people associate Information Visualisation with computers. In your opinion, what is the role that computers have to play in this context?
Bertin: The use of computers shouldn’t ignore the objectives of graphics, that are:
1. Treating data to get information.
2. Communicating, when necessary, the information obtained.
Computers are able to multiply useless images without taking into account that, by definition, every graphic corresponds to a table. This table allows you to think about three basic questions that go from the particular to the general level. When this last one receives an answer, you have answers for all of them. Understanding means accessing the general level and discovering significant grouping (patterns). Consequently, the function of a graphic is answering the three following questions:
A. Which are the X,Y, Z components of the data table? (What it’s all about?)
B. What are the groups in X, in Y that Z builds? (What the information at the general level is?
C. What are the exceptions?
These questions can be applied to every kind of problem. They measure the usefulness of whatever construction or graphical invention allowing you to avoid useless graphics.
The Bertin projection was created in 1953, but (in 2013) there was still no formula to describe it. It only existed as a drawing, with people passing around copies of a base map in Adobe FreeHand.
You might like to read a longer writeup by Fil about the Bertin implementation on Visionscarto, but one detail that I find wondrous is how short the implementation is in the end, when implemented for d3-geo (Github), only about 20 lines of code!
I think you'd be hard pressed to find a better example than this that illustrates why D3.js seems borderline immortal as a library. This 4-years-of-research-distilled-to-4-lines-of-code showcases very well how the abstraction level and modularization that D3 provides is surgical to the level of uncanny:
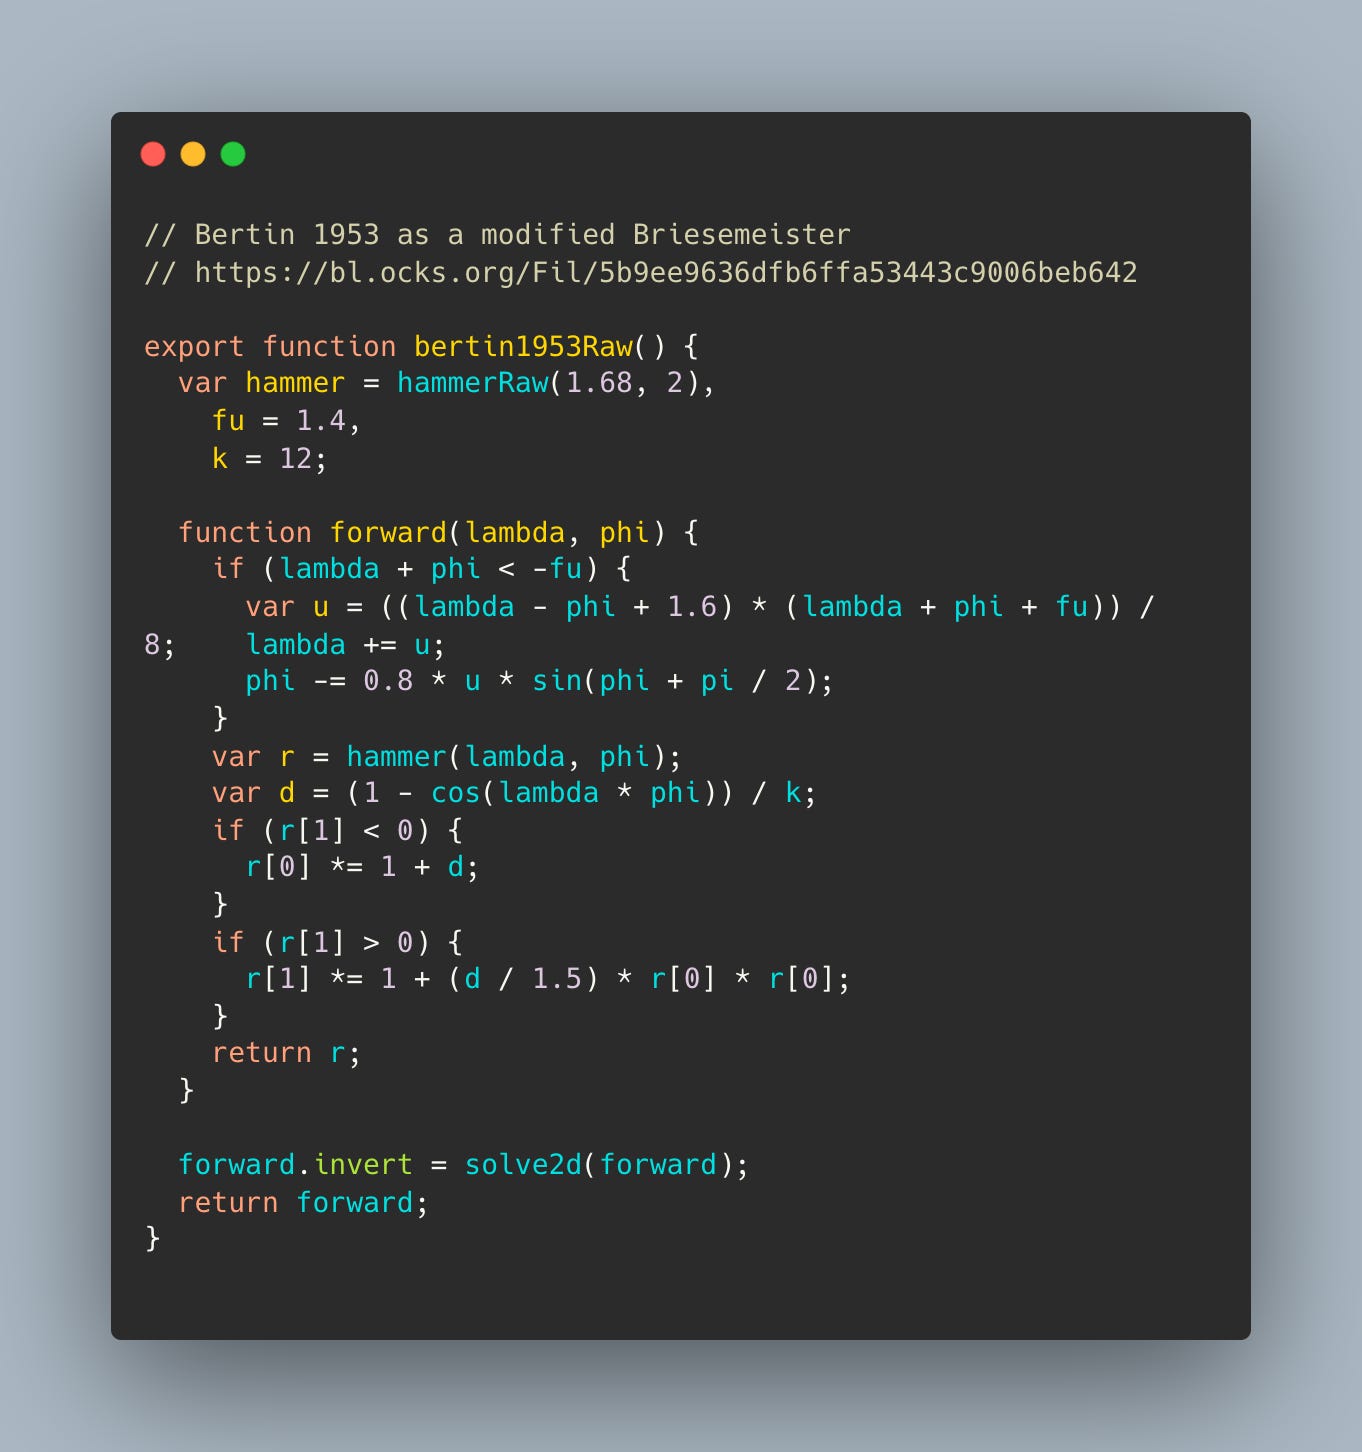
On a grander scale, it is also an incredibly concrete example of how programming languages (and math) is human language for expressing very specific concepts, not the language computers (or nature, for that matter) speaks.
Programming languages and math is what we use to speak to one another, and to think clearly, both ourselves and together.
This is not really rocket surgery to realize but it really bears repeating, because it is not obvious to an outsider. You've probably heard the misguided but popular sentence "the next programming language is English" a couple of times in the last few months, and reading this implementation is a clear demonstration of why we have programming languages (and math). There is nearly no accidental complexity in this implementation, i.e. no technical aspects to hide. Expressing this in English would not only be awkward, it would be impossible.
When we automate, what loss is the most subtle?
I do use AI tools extensively (and proudly partner with some) but I think that an enormous amount of the excitement right now is actually the hope for "artificial work" or "artificial interest" or "artificial attention".
Fil: "When I started making maps, I thought that automation would be a good idea. I wanted to make a 'machine' that would save Reka a lot of time. I've since realized that there is a lot of value in making maps slowly."
Laziness is important. It is especially an important trait as a programmer, but cultivating a narrow specialization and respect and interest for what you do is almost a value in itself. Automation, especially the kind of automation that is currently receiving trillions of investment, almost inherently needs to gloss over details.
Fil: Sometimes I see maps using a dataset as the source of truth. If a point is missing in the dataset, then it's often excluded from the map, and people will just say, 'Oh, there's no data.' But that's not true. It's not that there's no data, there's just no data in this dataset.
_Take a statistical indicator of literacy by country. That value is likely not changing much from year to year for any given country, so we may be able to infer literacy data from another recent year. But, we tend to not do that research anymore. We don’t say “Oh, that’s an interesting question, I have to call someone to find the answer,” or try to interpolate or extrapolate values from existing data.
_
We probably need a slow cartography movement, similar to the slow food movement. And there are still people who are doing the work very slowly, even though it’s much easier to make quick maps that have gaps. Taking the time to go through everything carefully, and asking questions when something isn’t obvious, is really important.
God I love this guy, if I were a zombie I'd want to eat his brain so much.
"A couple of Human Brains and a Laptop"
This theme of narrow focus yielding unexpected depth appeared again in the Organizational Networks episode of the wonderful Data Skeptic: Graphs & Network podcast, interviewing the wonderfully interesting Hiroki Sayama (posting as @hirokisayama on Bluesky), a SUNY Distinguished Professor of System Science and Industrial Engineering.
Hiroki led a project to extract network structures from corporate organization charts in PDF format. If you've ever seen corporate org charts, you know they're a zoo of inconsistent formatting nightmares.
Some might assume that the solution here was to throw thousands of dollars of GPU at this problem. Hiroki's approach? Pure heuristic image processing—essentially developing logical rules step by step.
Hiroki: We didn't do any AI or machine learning kind of stuff. Everything was based on logical steps. And yet we were able to generate the graph object for 46% of the original images.
Hiroki isn't an AI luddite - they leverage AI extensively in other projects elaborated on in the podcast, but for the particular case that they had in the above, there just wasn't a 'right' way to train the model, the problem domain was just too ... unsolved, and then we need to roll up our sleeves.
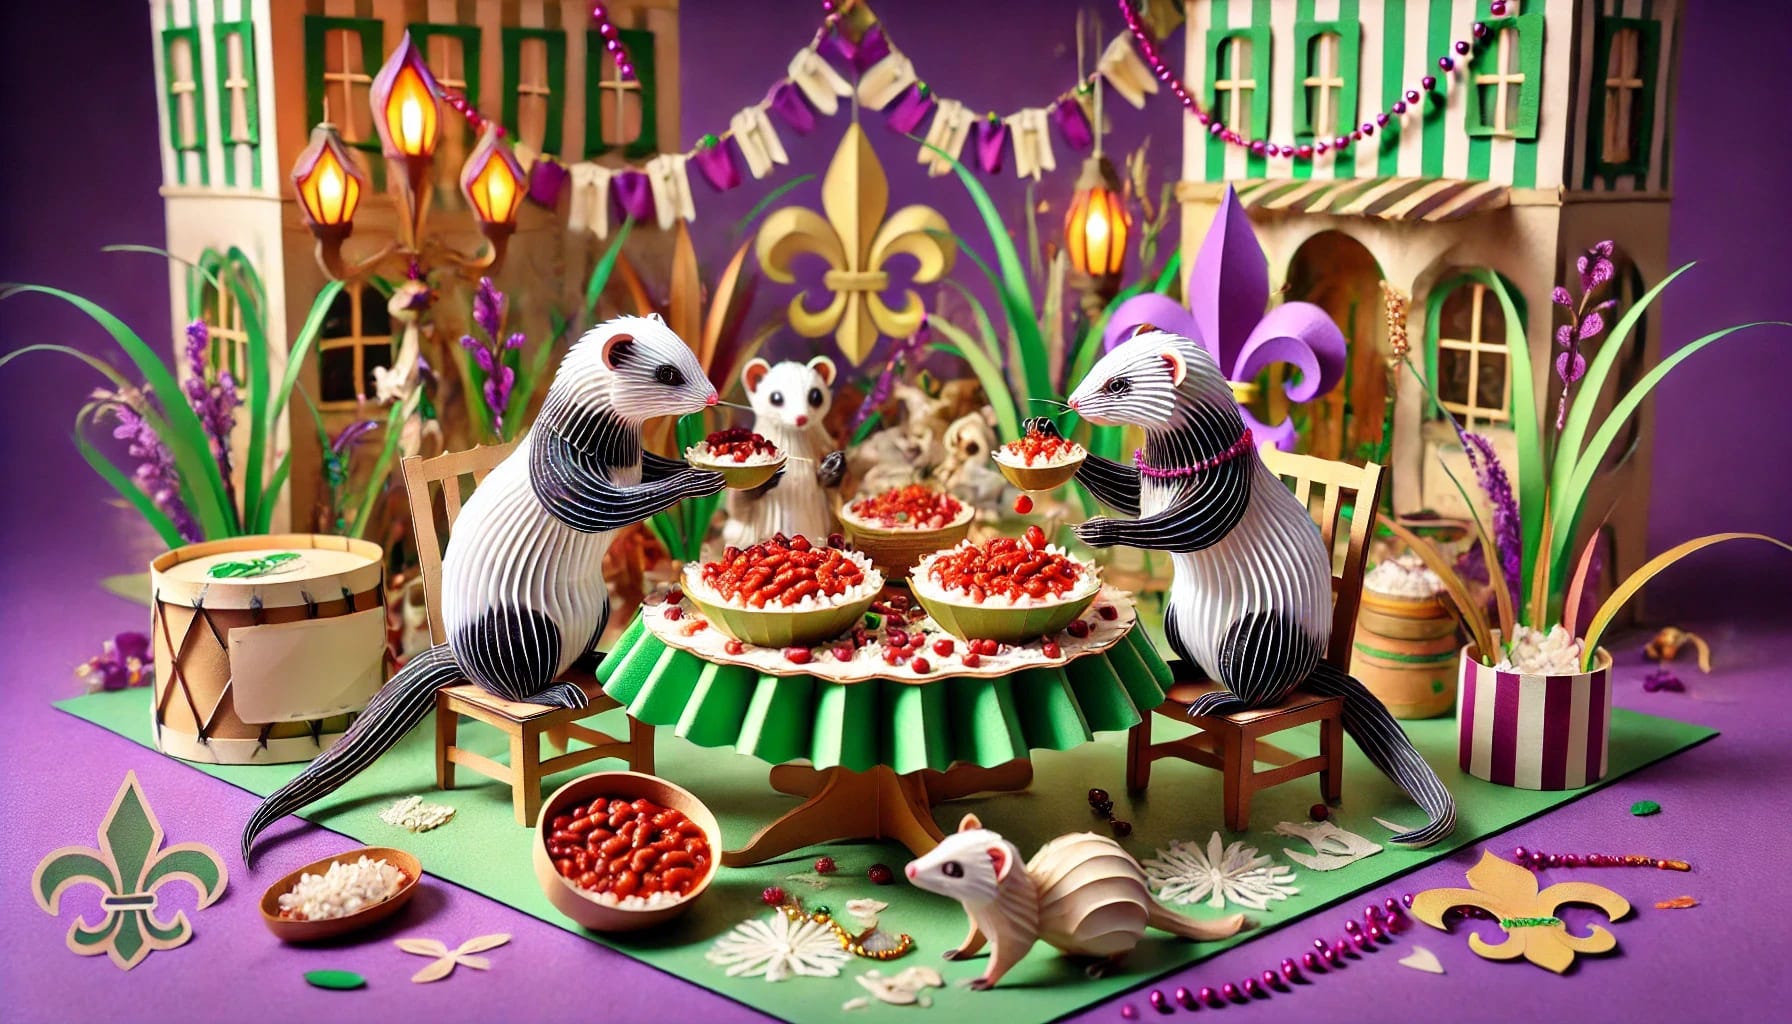
The Soul of a Table: Pableaux Johnson's Monday Night Ritual
At the end of every Monday in New Orleans, people gathered for a meal, around a Formica-topped oval table.
"In New Orleans, supper is never just a meal. Nowhere do Louisiana's French roots show as deeply as in the centrality of food to its social life."
The table wasn't particularly elegant.
It wasn't from a formal dining room but from a kitchen—the one where Pableaux Johnson's grandmother had fed him and his 23 cousins across generations. As he would often remind guests, "Tables have souls after a fashion. They retain the traces of all those who have gathered. And this table needs to be fed at least twice a week."
So he fed it, creating one of New Orleans' most vibrant dinner communities through a ritual of radical constraint:
The menu never changed: red beans and rice, cornbread, and bourbon for dessert.
There were rules -
no phones
don't sit next to someone you know
pay attention to those around you
Between 8-12 people would gather each week, a deliberately diverse group that Pableux curated with the same care as his slow-cooked beans, ensuring that the same constellation of people never occurred twice.
Pableaux died the other week, which made me aware of his existence because the foodie internet exploded in remembrance. I particularly enjoyed reading/listening to [“It’s not a dinner party, it’s just supper:” Monday nights with Pableaux Johnson over at The Splendid Table.
What's appeals to me about these dinners wasn't what they included, but what they deliberately left out. No menu choices. No technology. No sitting in your comfort zone.
The constraints weren't limitations, or I mean, they were, but they were the secret ingredient. By narrowing the focus, Pableux created an environment where the only thing to do was connect deeply with the strangers beside you and the familiar food in front of you.
Assumptions and defensive optimizations
Looking at the unassuming 20-lines of bertin.js projection, you'd be forgiven for missing that there were four years of research by a very competent person behind it. In the same way, when I read Pableaux talking about his praised dinners, the developer in me really appreciated the near-algorithmic thinking going on below:
Pableaux:
It didn’t start off quite as random. Before I lived in New Orleans, I lived in Austin [Texas] for about 10 years. My entertaining style in Austin was doing whole-day parties – big gumbo and red beans parties – that eventually 150 or 200 people would come to over the course of a Sunday.
When I went to New Orleans, I had my grandmother’s table. I decided to switch to weekly because one of the long-standing food traditions of New Orleans is red beans on Monday night. Instead of doing 150 people once every three months, it became 10 to 12 once a week. That changed the rhythm of the way that I cooked, and that changed the menu I served.
It adapted to something that was easier and lower maintenance to pull off on a Monday. People aren’t often doing things on Monday nights so it tends to be free and a good break during the early workweek. It’s something to look forward to, and that’s where it came from. Once that ritual and rhythm was established, you have 10 to 12 seats to fill every week.
It started off with a smaller group of friends, then it became bigger, and everybody rotated in and out until it was a large-format, kismet-driven, weekly event that everybody looked forward to.
[...]
Interviewer: I love that it’s the same thing, not just in terms of ritual, but you have this thing that you’re doing every single week on the same day. It’s not entertaining. It’s not a dinner party. It’s not, “How am I going to impress people? What am I going to do?” You’re just feeding people, and it’s a constant. It’s as much about the idea of ritual, community and family as it is “Hey, let me cook for you this awesome thing.”
[...]
Pableaux: There have been attempts at different times for people to do things like, “We should bring a salad. Can I bring a salad?” I try to gently discourage that. Part of it is I don’t have 12 salad plates. And once you start adding different complicated components to it, things get complicated very quickly. That’s also about twice as many things I have to clean up – and I’m cleanup adverse. I like having it be “serve yourself.” I put a roll of paper towels on the table for linens. I put the spoons in the middle. Everybody gets their own drink and it’s self-serve. If you want more, get up and get it.
The above exposition strikes me as both so down to earth yet also algorithmic. It is iterative, like good development - assuming nothing, generalizing and optimising defensively. I know from hiring a lot of career-switchers that journalists and lawyers make great programmers quickly, and I theorize that chefs do, as well.
Will you be narrow for me this week?
It is easy, in this particular day and age, for me to feel the pressure to know more, do more at scale, automate more, summarize more, absorb more.
But perhaps another tactic, another response, is to slow down, pay more attention, learn to be more manual, more precise, with deep engagement of a specific problem. Go narrow.
Be a light, not a judge. Be a model, not a critic.
And, as always, stay curious. 🧐🐒
Mattias Petter Johansson
Wow, this was a refreshing read! Thanks MPJ.