
William Playfair: Inventor of statistical graphics and scoundrel extraordinaire
The 18th-century polymath who invented the line, bar, and pie chart — and spent the rest of his life as a rogue.


Good Monday Morning!
William Playfair: Inventor of statistical graphics and scoundrel extraordinaire
It has not eluded any reader that I have gotten obsessed with time series plots lately. I can reveal that the next video that I am working on is a spoken word piece about time series plots, and in this weeks chronicle, I aim to further dive into this rabbit hole, and start writing on the story of William Playfair (Wikipedia), my new favorite criminal and data visualizer.
Absurdly enough, it was only this week that I ever considered who actually invented line plots. It’s one of those things that seem so obvious that it them having an inventor seems unintuitive.
A wonderful reader of last weeks chronicle sent me some clippings from the book The Visual Display of Quantified Information by Edward Tufte, that made me do a double-take:
“Hang on a freaking minute, are those hand-drawn?”
Being a total data street urchin, I did not know about Tufte, which is a character in himself - besides being a data visualization luminary, he is an artist with an enormous sculpture garden:
Hogpen Hill Farms: Amazing sculpture park hidden in the hills of Woodbury

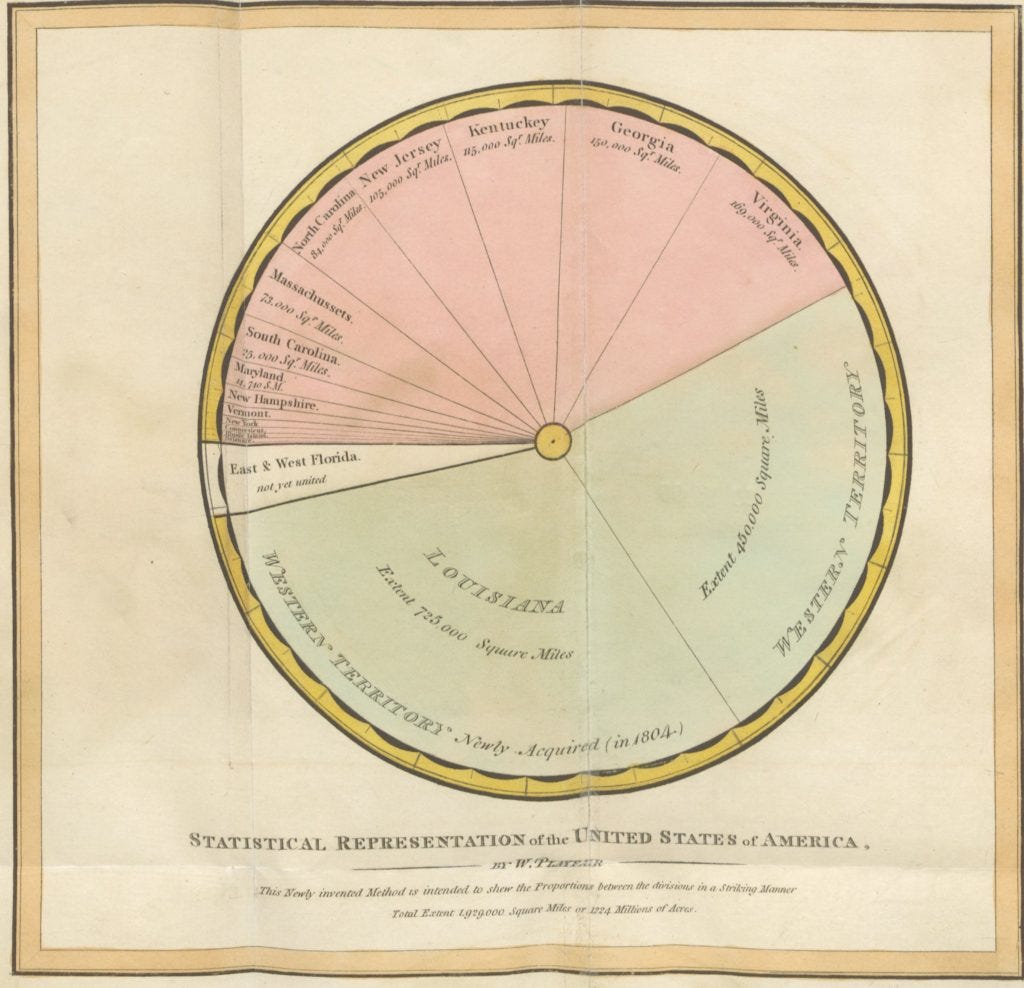
But I digress - ANYHOO - the data drawings above were not made by Tufte, but are reproductions of the works of William Playfair, who was the first to devise and publish all of the common statistical graphs - the pie chart, the bar chart, and the statistical line graph.
Yes, you read that right, William invented or improved 3 of the 4 fundamental types of statistical graphs (the scatter plot appearing first at the end of the 19th century.
Sidenote: Is it only surprising to me that the scatter plot came AFTER the line plot? I always have assumed that line plots naturally involved on top of scatter plots.
But I (yet again) digress from the arguably enormous digression that I intend to make, which is how incredibly esoteric William Playfair was.
Where do I even begin?

From the book "Statisticians of the Centuries":
"Despite the importance of Playfair's innovations, his name is largely un__known, even to professional statisticians, and those who have heard of him know little of his life.
One might expect a life of the inventor of statistical graphs to make dull reading, but Playfair pursued a variety of careers with such passion, ambition, industry, and optimism that even without his great inventions, he would be judged a colorful figure.
He was, in turn, millwright, engineer, draftsman, accountant, inventor, silversmith, merchant, investment broker, economist, statistician, pamphleteer, translator, publicist, land speculator, convict, banker, ardent royalist, journalist, editor, and blackmailer.
His business activities were sometimes questionable, if not downright illegal, and it may fairly be said that he was something of a rogue and scoundrel (Spence & Wainer, 1998)."
What. The. Actual. Fuck.
Sitting in the early morning in a cafe next to my hostel, reading into the history of the origins of statistical graphics, this was not what I expected.
okidokey then - not only am I going to spend this weeks chronicle entirely on Mr Playfair - this is going to be a recurring series that will hopefully be a series of videos eventually*.
* = Fair warning: This content creator has promises like this once or twice before.
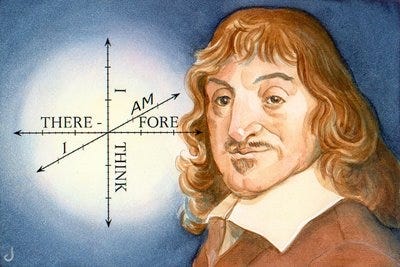
I was initially going to talk about William in just the intro of this chronicle and then make a list of data resources, but Williams story is too vast, set in the era of Descartes, Napoleon, David Hume, Adam Smith, the french revolution, the invention of the steam engine, protests (and hangings) against agricultural automation - Playfair lived during a titanic shift in history and knowledge, arguably in the greatest melting pot of engineering and science since Ancient Athens.
If I personally had to pick an era in history to live in, I would have picked the one William lived - I can't envision someone more actual steampunk than this man.
The book quote above omits one title that of Playfair that is more contested: Spy.
Playfair was said to have acted as a secret agent for British government and devised a plan to inflate the french war chest away by counterfeiting and distributing one hundred million Assignats (the french currency at the time).
Not only is that insane in itself, but it actually has seemed to also work - by 1795 the French assignat had become worthless and the ensuing chaos undermined the French government.
YES THE INVENTOR OF THE LINE PLOT IS BELIEVED TO BE A BRITISH SPY THAT TOOK DOWN THE FRENCH CURRENCY
To be clear, while Playfair was a lot of things, the spy thing is most likely and disappointingly untrue (the book The Flawed Genius of William Playfair contests it decidedly). However, I love the story, and it does paint Playfair in a light that makes my point easier to make so I'll keep it in here - even though I admit it to be false - a trick I will henceforth try to popularize as "Feasting on cats and dogs". 😉
When you consider what the line plot actually is, I think it required the mind of a really scruffy polymath to envision. While a line plot might seem like a fairly obvious thing to us now, repurposing Cartesian systems to visualize datasets was unheard of in 1786 (and pretty much visualizing data in general) and was a really weird thing to think.
Playfair’s impure use of Cartesian coordinate systems challenged the prevailing standards of his time, which largely dismissed such graphical representations as unscientific or unsophisticated for academic discourse.
Basically, you'd need to be little a bit nuts in your thinking to invent line plots. I imagine that if Playfair had been a modern-day employee at CERN, he'd be chilling out looking at the Large Hadron Collider and toying with thoughts like "Hmmm, I wonder if one could use the LHC to open a can of Pepsi".
Rene Descartes introduced the use of a coordinate system (X and Y axes) that allowed equations to be plotted as curves or lines, representing abstract, mathematical relationships. This laid the foundation for analytic geometry, where graphs typically represented theoretical or algebraic relationships rather than empirical data.

But for Descartes and his successors, graphs were used to illustrate precise, known mathematical functions. Cartesians did not at all intend for this to be used for exploring patterns in raw, real-world data. This tradition set a rather formal tone around graphs, aligning them with the rigorous, logical depiction of mathematical truths—not with the messier, sometimes ambiguous representations of empirical observations (e.g., data collected from nature or society).
Playfair, however, used graphs to depict statistical data—actual empirical observations, such as trade balances, national debts, and economic trends. This was a radical departure from the Cartesian approach, where graphs were seen as purely mathematical tools. Instead of plotting functions, Playfair plotted real-world numbers, encouraging readers to observe trends, patterns, and relationships in data, and published them outside of scientific journals.
Playfair broke away from this tradition, suggesting that graphs could indeed help us understand real-world phenomena. It is hard to overstate what a wonky person and mind is required for this to happen - someone with the technical know-how that also comes from another direction than the tradition, AND the aesthetical skill to produce these as drawings.
Playfair rejected the part of Cartesian tradition that postulated that graphs should only illustrate abstract functions, pushing instead for a new paradigm where graphs could explore real-world patterns, helping people to see data-driven insights in entirely new ways.

William had a rather gritty childhood in Dundee, Scotland. It was a modest household, shadowed by the early death of his father, Reverend James Playfair. This means that he was largely raised by his elder brother John, one of Britain's foremost mathematicians and scientists as Professor of Natural Philosophy, Mathematics, and Geology at Edinburgh University.
Having lost his father at a defining time in his life, I imagine William to have had a quite active and practical mind, as minds growing up in less secure environments often become.
Threshing Machines
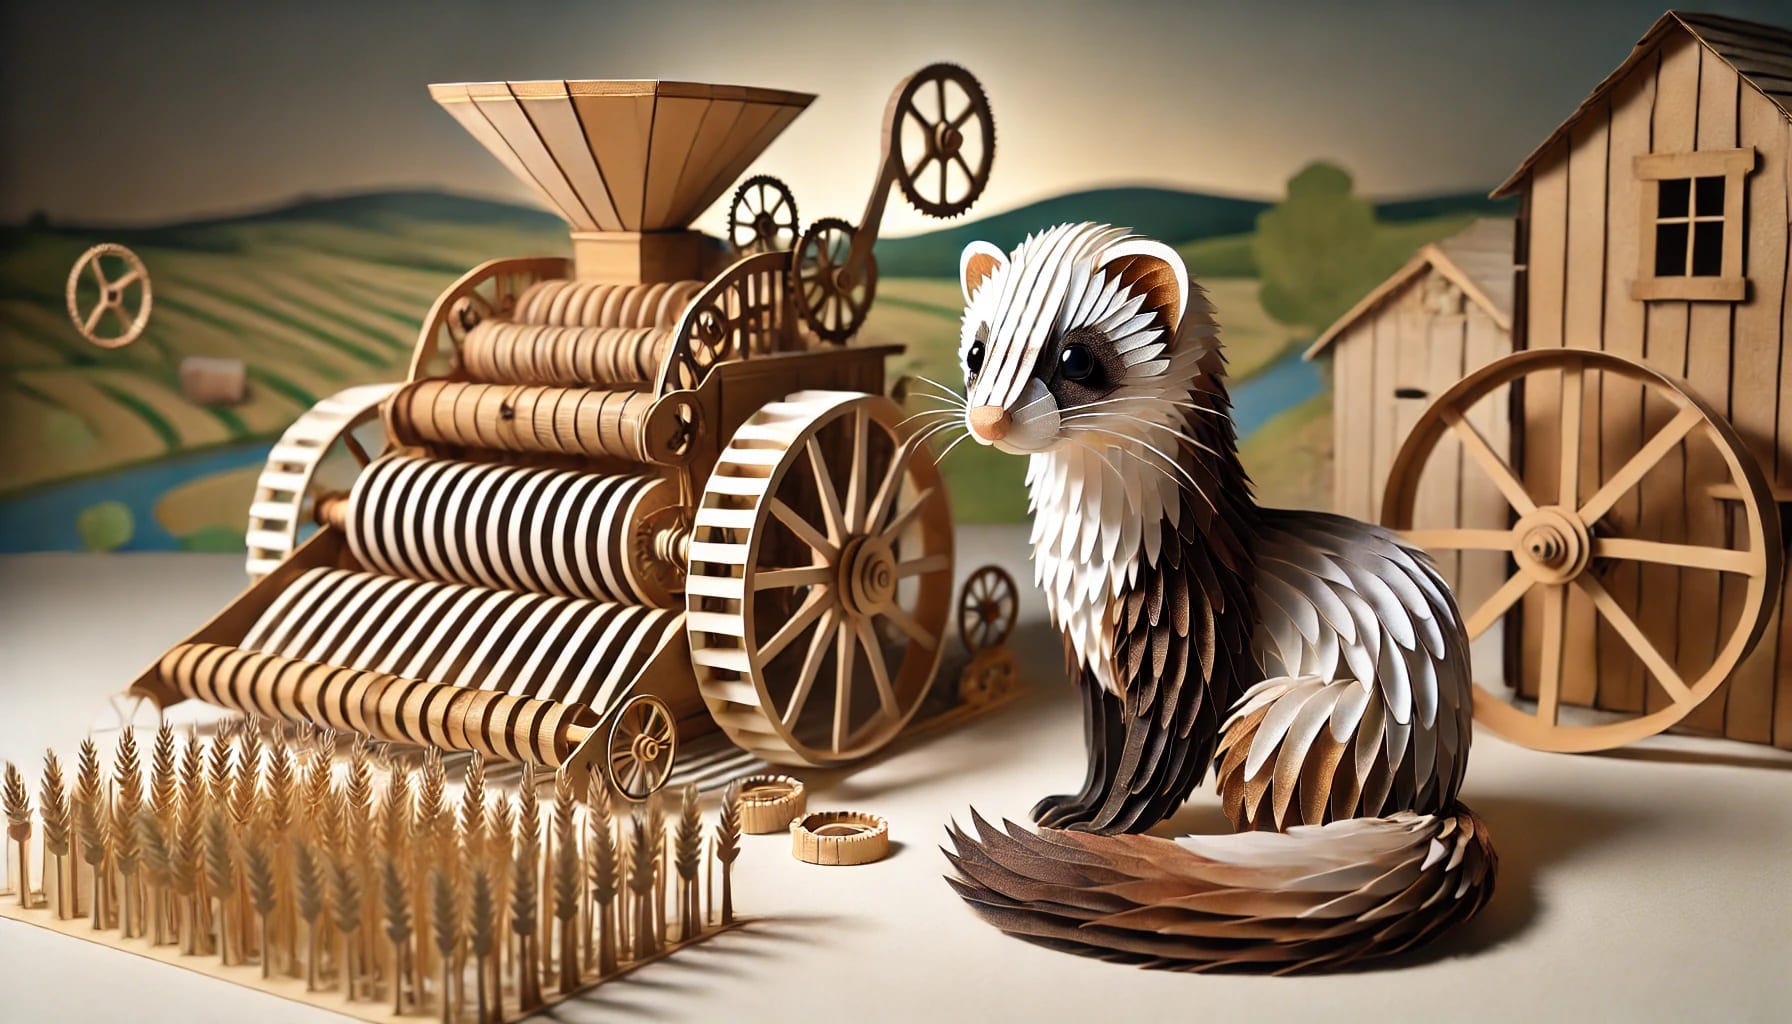
William would have been 17 years old when he landed an apprenticeship with Andrew Meikle (Wikipedia), inventor of the threshing machine, an extremely influential step in the history of automation.
This hands-on experience would have been formative, grounding him in practical engineering, and also likely influenced Williams later interest in both innovation, agriculture and economics - without which he would not have invented the visualization tools we enjoy today.
Meikle’s threshing machine stood out among inventions at the time - it mechanized the very labor-intensive process of separating grain from stalk, a job once done by hand with flails. The machine increased productivity so dramatically that it foreshadowed the broader mechanization wave that would soon reshape society.
Automation anxiety in Scotland

Threshing machines stirred anxieties similar to those around automation today: they threatened traditional farming jobs and stoked fears of technological unemployment.
Scottish farmers (and eventually English ones, too) rioted against their widespread adoption, viewing them as symbols of dispossession and displacement. These reactions echo today’s concerns about AI and automation, where technological efficiency collides with social stability and employment security.
Before threshing machines, threshing was an intensely laborious, backbreaking task. It was typically done by agricultural laborers, often hired for short-term work during the winter months, and involved beating harvested grain with a flail to separate the kernels from the stalks. It was dusty, repetitive, and exhausting, requiring long hours and constant physical exertion.
For these workers, threshing was crucial because it provided seasonal employment and kept them afloat during the colder months when other farm tasks slowed. So, while it wasn’t particularly pleasant work, it had a critical role in rural economies: it gave laborers a reliable, albeit low, income in an otherwise difficult time of year.
With the advent of the threshing machine, however, this winter work began to disappear. Andrew Meikle’s invention mechanized what had been a manual process, massively speeding it up and allowing fewer people to process more grain in far less time. This productivity boost benefited landowners, who could make larger profits with reduced labor costs.
But for the workers, it was a disaster. Their dependable winter job was being erased, and with few alternative opportunities, they faced severe financial hardship.
The Swing Riots
The loss of work led to widespread anger and unrest. In some regions, desperate laborers took matters into their own hands, sabotaging threshing machines and destroying property in an effort to stop their spread.
Much later, a few years after William Playfairs death, this movement became part of the larger “Swing Riots” - a name derived from Captain Swing, the mythical figurehead of the movement, that was the signatory of threatening letters sent to farmers, magistrates and parsons. 'Swing' being a reference to the swinging stick of the flail used in hand threshing.
(I personally got introduced to the concept of a Flail (Wikipedia) as a weapon in D&D that does 1D8 bludgeoning damage, and did not know about it's agricultural roots)

It's kinda wild (and sobering) to learn about how automation really has done quite significant disruptions throughout history.
In response to the sabotage of machinery and the movement in general, landowners and authorities reacted with ruthless suppression. The landowning class in England felt severely threatened by the riots and responded with harsh punitive measures.
Nearly 2,000 protesters were brought to trial in 1830–1831; 252 were sentenced to death (though only 19 were actually hanged), 644 were imprisoned and 481 were transported to penal colonies in Australia.
Not all rioters were farm workers since the list of those punished included rural artisans, shoemakers, carpenters, wheelwrights, blacksmiths and cobblers. One of those hanged was reported to have been charged only because he had knocked the hat off the head of a member of the Baring family. Many of the protesters who were transported had their sentences remitted in 1835.
If you are familiar with UK banks and wondering if the Baring family is the namesake for the infamous Barings Bank (Wikipedia) that collapsed in 1995 due a massive derivatives trading fraud, then yup, it’s the bank they started with them sweet threshing machine money .... and also had someone hanged for knocking off a family members hat, there is that.
This brutal response left a lasting impact on rural communities, spreading fear and entrenching social divides.
In many ways, it highlighted the tensions between technological progress and social stability—a dilemma that still resonates today as automation affects various industries.
Graphing National Debt
Even though this crescendo happened after William Playfair died, he likely saw these conflicts and trends early on, informing his future work in economics and statistics, where he was deeply interested in understanding economic patterns, labor markets, and the broader societal impacts of industrialization.
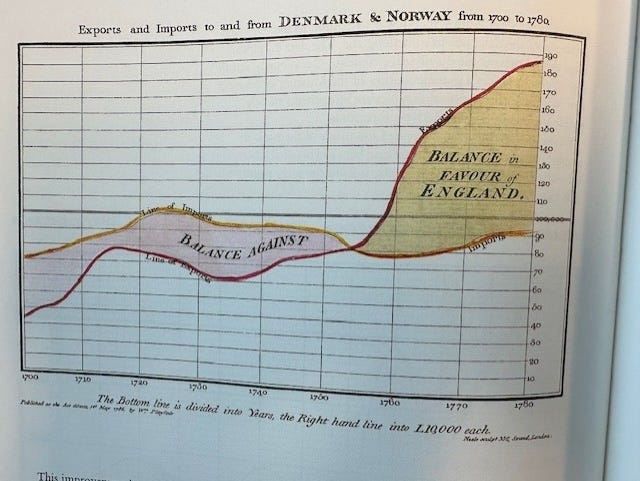
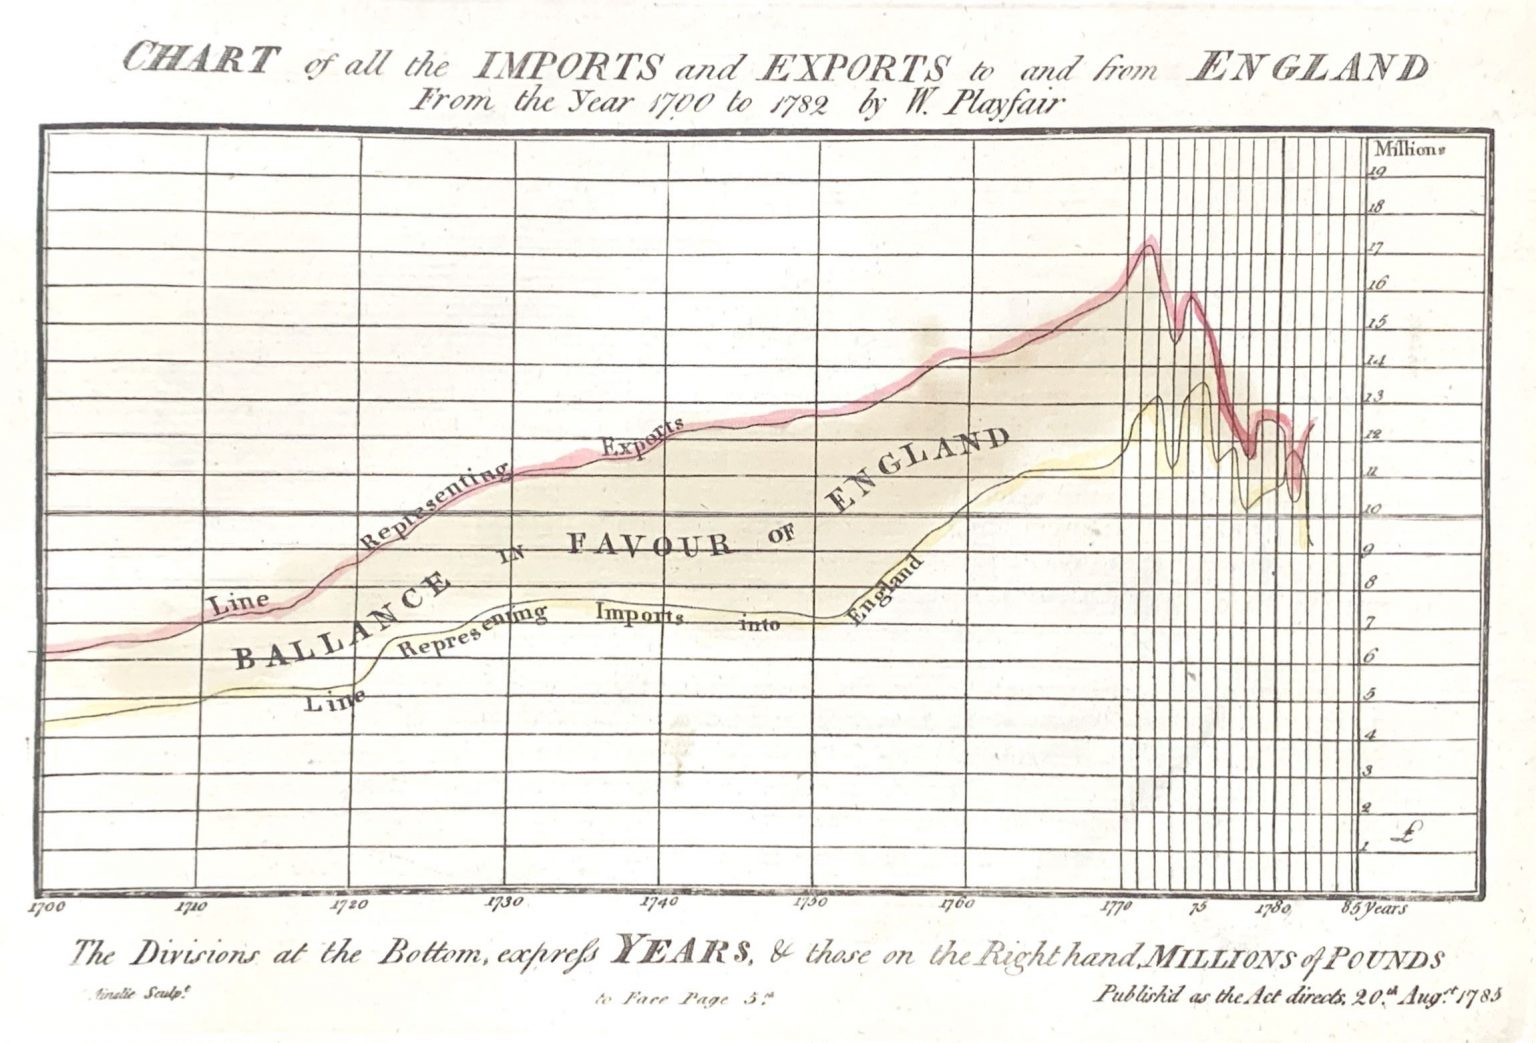
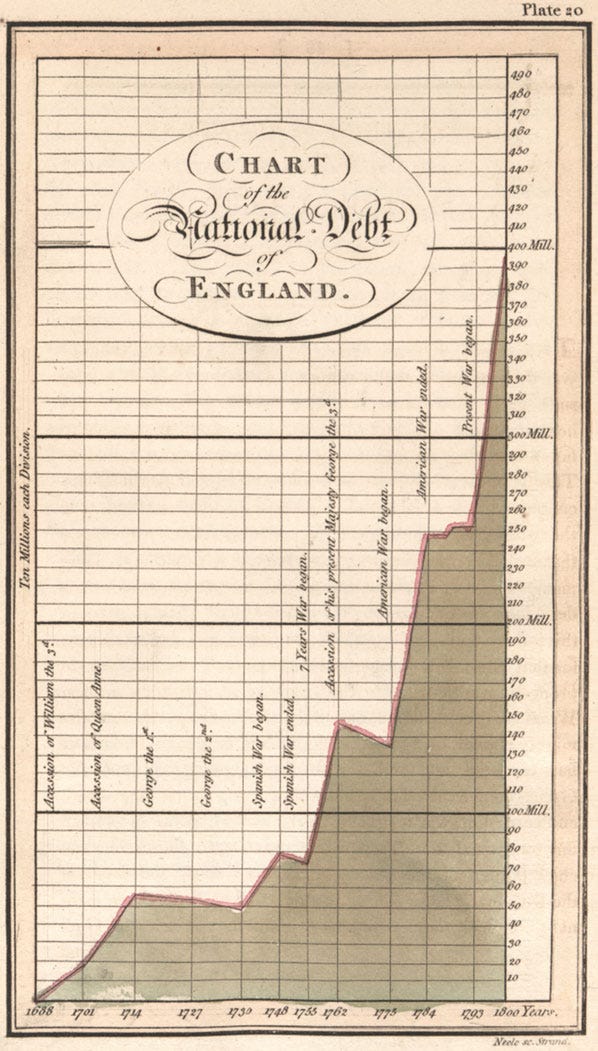
One of Playfair's most striking visualizations that resonates with the plight of agricultural laborers is his Chart of National Debt (depicted above).
This chart is part of his seminal work, The Commercial and Political Atlas, published in 1786. It used time-series plots to depict the growth of Britain’s national debt alongside trade balances.
By visualizing this economic data, Playfair was able to illustrate the broader impacts of policies on British society, particularly the pressures of war financing, taxes, and trade deficits, all of which affected common laborers deeply.
During the period Playfair charted, Britain was amassing debt from its conflicts, notably the American War of Independence, which led to an increase in taxes. These taxes fell heavily on lower-income groups, including rural laborers, intensifying economic hardship at a time when mechanization was also reducing job security.
I can't help to think that there might be a lot to learn from this period of history, and that the issues being discussed today might not be as new as they seem.
Nugget of the week
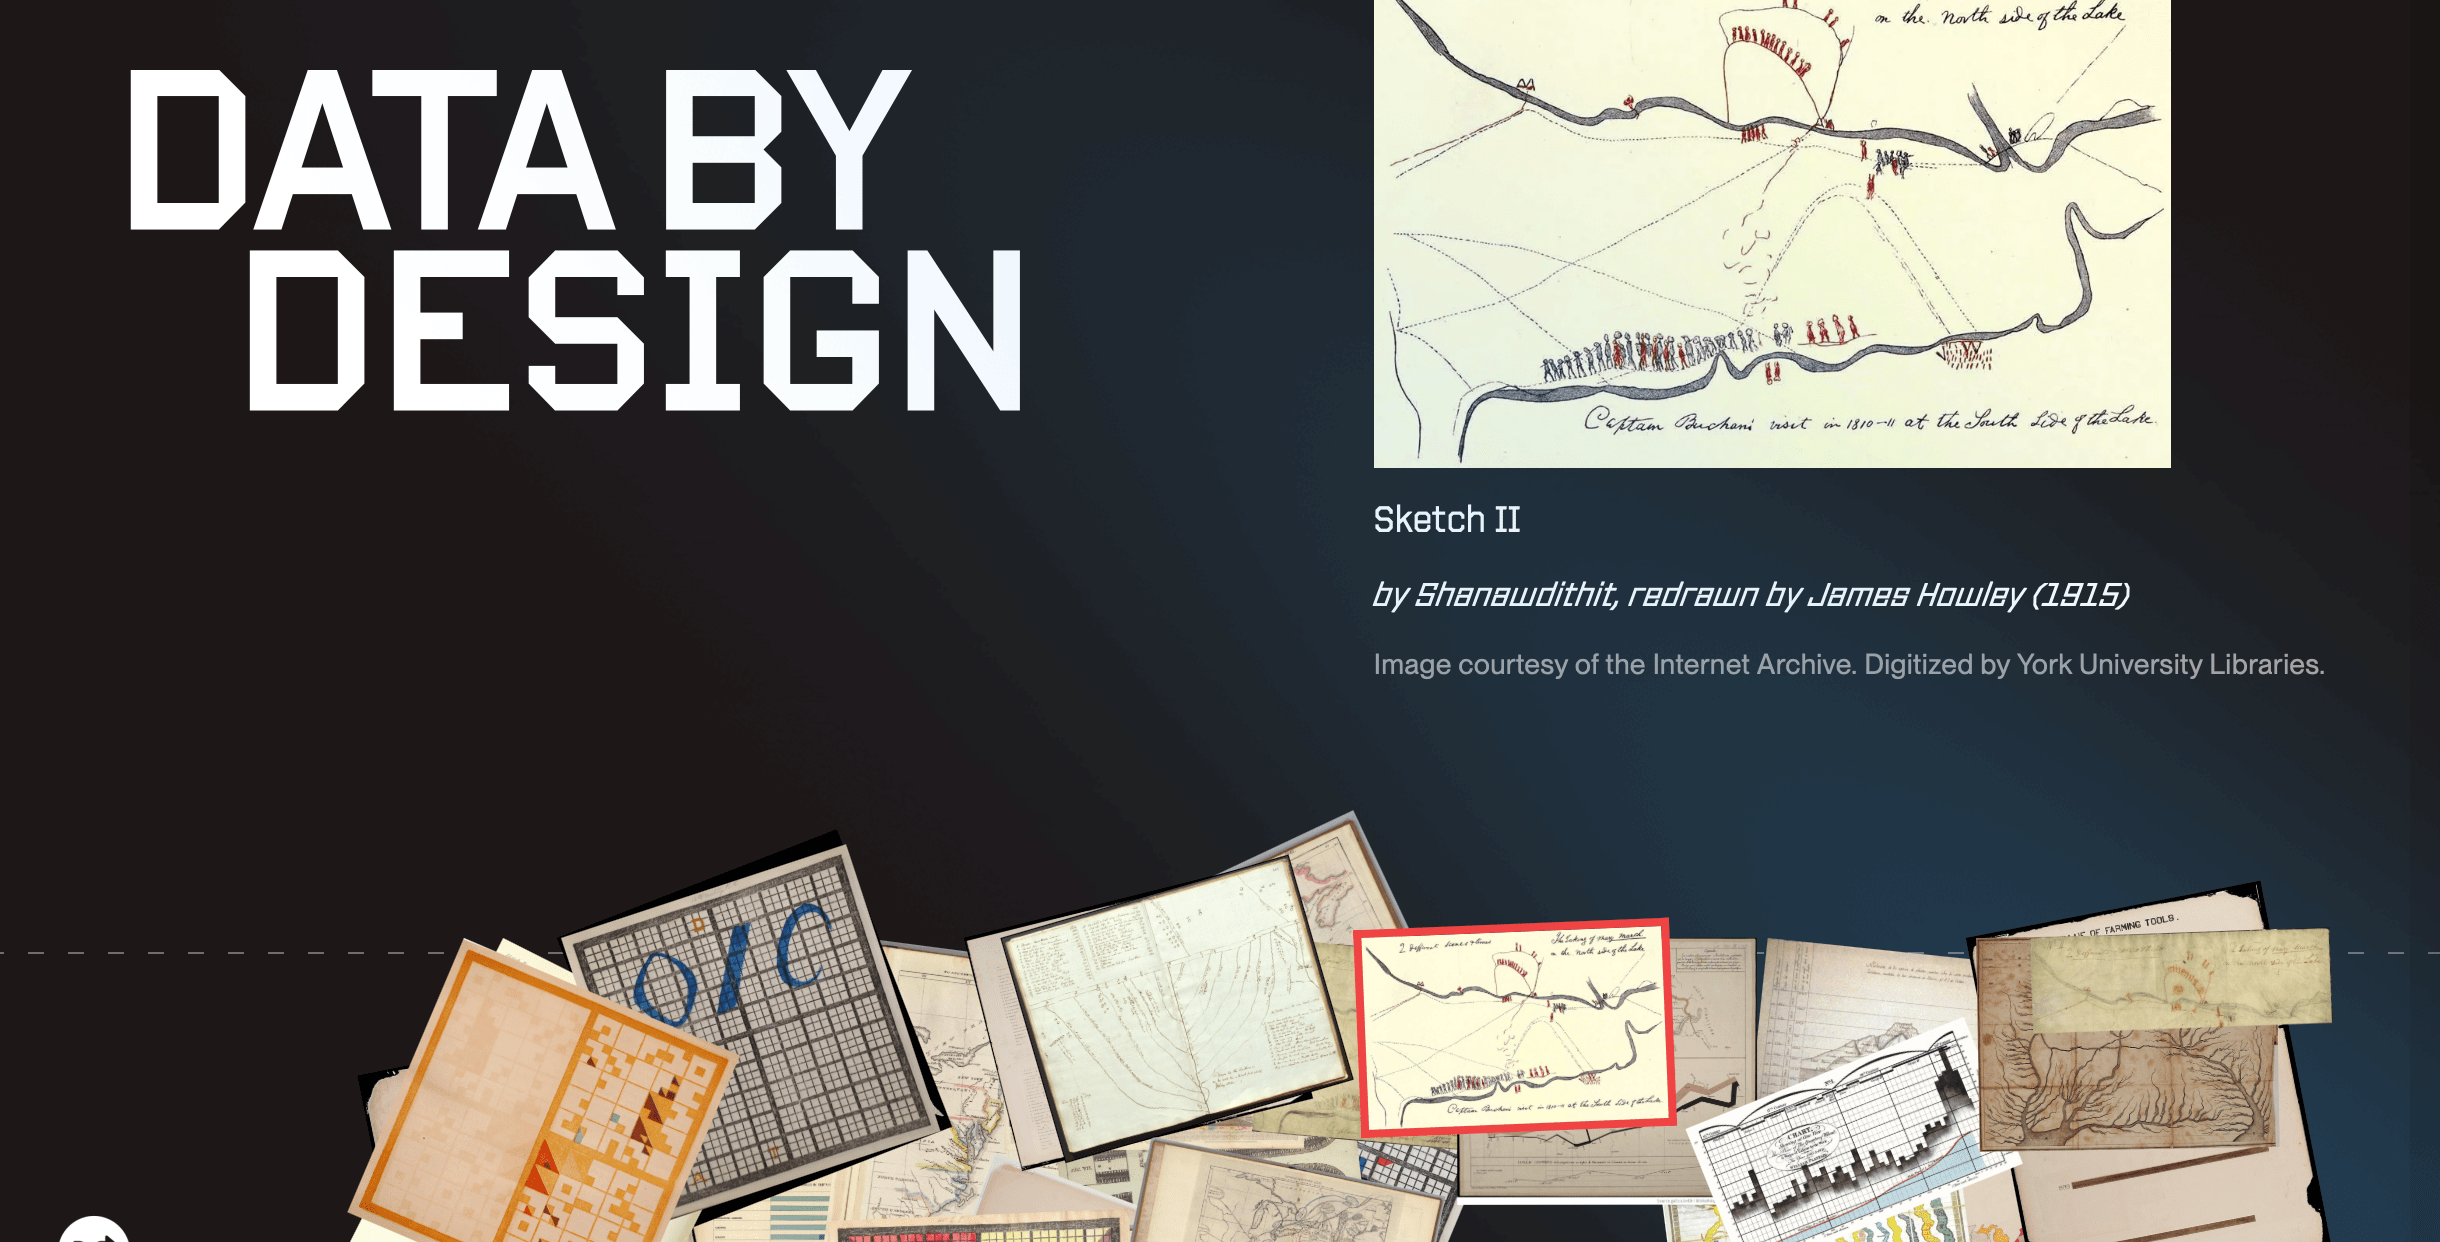
While doing research for this chronicle, I ran across Data by Design, a project and print book coming out in 2025 that seems absolutely amazing and their site is kind of a online beta version of the print book, really cool project.
It has an incredible segment on Playfair called "Visualization as an argument", that features a really inspirational scrollbar-design for data.
And may you have a great week!
Stay Curious.